Announcement

Collapse
No announcement yet.

backtesting question

Collapse
X
 
  • Filter
  • Time
  • Show
Clear All
new posts

  • backtesting question

    Hi, I've begun to use the backtesting. I'm alittle new at this and have going through the tutorial found on this board. Anyways, when using any of the prefabbed efs studies in the tutorial, when I go to backtest, I get this popup:

    retrieving data... 0 bar received.

    anyways, it hangs for a long, long time, so there must be a problem. I have a feeling this might be a common errror, and wonder if there is any solution.
  • #2
    Hi,

    I'm curious as to which formula you used? Was it in the Formulas --> Backtesting folder from within eSignal? Also, what version of eSignal are you currently on.

    As much information that you can provide about the formulas used would help me out.

    Thanks,
    Andy

    Comment


    • #3
      Hi,

      I don't know if you ever solved this, but I've got exactley the same. I tried it first on something I'm trying to write in efs as a learning experience and assumed it was my script, but it does it with btEMA supplied backtest script as well.

      Just get 'retrieving data...0bars recieved'

      And it just sits there.

      Comment


      • #4
        PJS,

        I believe this happens when the chart has not loaded the data for the symbol and interval requested in the backtester. Here's the method we suggest for using the backtester.

        1) Pull up the symbol and interval you want to back test on an Advanced Chart.
        2) Right-click the Advanced Chart, and select Tools --> Back Testing
        3) Then proceed by filling in the remainder of the Back Testing dialog box that pulls up.

        This should solve that problem. If it does not, please let me know what symbol, interval, and Time Template you are using.
        Regards,
        Jay F.
        Product Manager
        _____________________________________
        Have a suggestion to improve our products?
        Click Support --> Request a Feature in eSignal 11

        Comment


        • #5
          video tutorial?

          Jay, could you make one of those video tutorials for the backtesting feature in esignal?

          Comment


          • #6
            n23mc,

            I believe the goal for the new year is to create more and more training videos, so I'll put this on the list of videos to create.
            Regards,
            Jay F.
            Product Manager
            _____________________________________
            Have a suggestion to improve our products?
            Click Support --> Request a Feature in eSignal 11

            Comment


            • #7
              Sounds great.

              A video on the very basics of EFS would be useful too.

              Comment


              • #8
                I've had this problem as well (using my own formula). Like suggested previously, it seems to occur when there is a lack of data.

                Still, this seems to be a problem since it just hangs there. I've found that, if you hit "cancel" on that dialog and then run the test again it works - kinda.

                However, I've not found a way to back test anything from before the time I became an esignal customer. I just can't seem to make a chart get any data before the start date of my subscription.

                Is this possible?

                Edit - upong further investigation, I now see that I do have some data from before my subscription but it is spotty - just a few intraday bars in any given day. It seems as though It got some data during one of those times I got the aformentioned dialog and then it hung up. Problem is, now I don't get the dialog anymore. My charts think they are complete even though they don't have all the data.

                How do I make eSignal go get the data I'm looking for (just looking for six months back) and not hang up in the process?

                Thanks.
                Last edited by ebr; 01-17-2004, 12:54 PM.

                Comment


                • #9
                  ebr
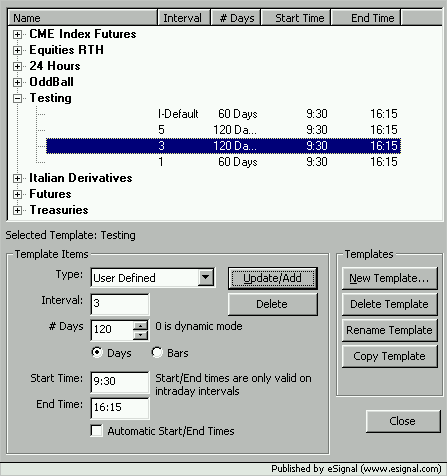
                  First of all make sure your Time Template is set to load the desired number of days in the chart. To access the Time Template right click the chart, select Time Templates->Edit. Then from the list of available templates select the appropriate one and check that either the Intraday Default or the intervals you want are set to load 120 days (see example in image below)


                  As to spotty data that may depend on the symbol. If you are looking at futures for example it could be that they were not the front month at that time.
                  Perhaps you may want to post what symbol(s) you are using so that someone else can check them too.
                  Hope this helps
                  Alex

                  Comment


                  • #10
                    Ya know...sometimes it just takes someone to nicely point out the obvious to see what an idiot you are .

                    Yes, I'm looking at futures - duh!

                    Thank you very much for "nudging" my brain cells.

                    Now, given that little revelation - is there a way to define a time template for a specific period that is not from current day back?

                    For instance, can I define a template for a chart (i.e. backtesting routine) to be from Sep. 12 - Dec - 17 for example, so I can do my backtesting in chunks?
                    Last edited by ebr; 01-17-2004, 09:08 PM.

                    Comment


                    • #11
                      ebr
                      With regards to your question a Time Template cannot define a specific period other than from current day back.
                      However you can still backtest from a certain date to another date that is not necessarily the current one by using the Bar Replay tool.
                      Once you have downloaded all the required data, right click the chart and select Tools->Enter Bar Replay Mode. This will open a new toolbar on the chart (see image)


                      When you enter that mode the cursor in your chart changes to replicate the first one on the left in the toolbar. If you click on any bar in the past the tool will essentially remove the data from that bar forward. At that point you can run the backtester which will use only the data visible in the chart.
                      Hope this helps
                      Alex

                      Comment


                      • #12
                        Thanks again. That should do what I need.

                        Now - if you don't mind - I've got one more (final, I think) question about backtesting:

                        Is there a way to write data into the Strategy Analysis report? My formula has a number of parameters and I'd like to have the values of those parameters listed in the report so I know what values produced those results. Is there any way to do this?

                        Comment


                        • #13
                          ebr
                          Not that I am aware of.
                          You may want to provide this suggestion to eSignal by writing to [email protected]
                          Alex

                          Comment

                          Working...
                          X