Announcement

Collapse
No announcement yet.

a simple question?

Collapse
X
 
  • Filter
  • Time
  • Show
Clear All
new posts

  • a simple question?

    Once I import an EFS study into the editor and save it, how do I get it to appear in a chart window? I know it's probably obvious but I can't seem to work it out.

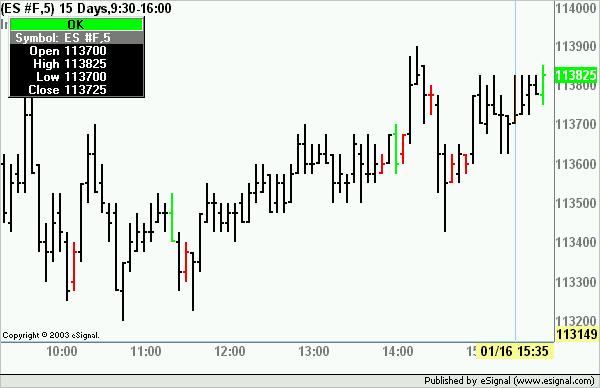
    Also does anyone have an example of an EFS study that colours inside and outside bars differently to other bars?

    Thanks in advance,

    Runningbear

  • #2
    Runningbear
    Once you have saved the efs to any one of the subfolders of Formulas then right click the chart, select Formulas from the context menu and navigate to the subfolder you saved the efs to and click it and the efs will load in the chart.
    Alex

    Comment


    • #3
      Runningbear
      Does your definition of inside/outside days refer to the body of the candle only or does it also include the wicks?
      Alex

      Comment


      • #4
        Runningbear
        The enclosed script will paint the inside/outside days in red/lime. In this case the formula uses the high and low to determine the pattern.
        Alex

        PHP Code:
        function preMain() {
            
        setPriceStudy(true);
            
        setStudyTitle("Inside/Outside");
            
        setShowCursorLabel(false)
            
        setColorPriceBars(true);
            
        setDefaultPriceBarColor(Color.black);
              
        }
        function 
        main() {

            if(
        high()>high(-1)&&low()<low(-1)){
            
        setPriceBarColor(Color.lime);
            }
            if(
        high()<high(-1)&&low()>low(-1)){
            
        setPriceBarColor(Color.red);
            }

        return ;

        Comment

        Working...
        X