Once I import an EFS study into the editor and save it, how do I get it to appear in a chart window? I know it's probably obvious but I can't seem to work it out.
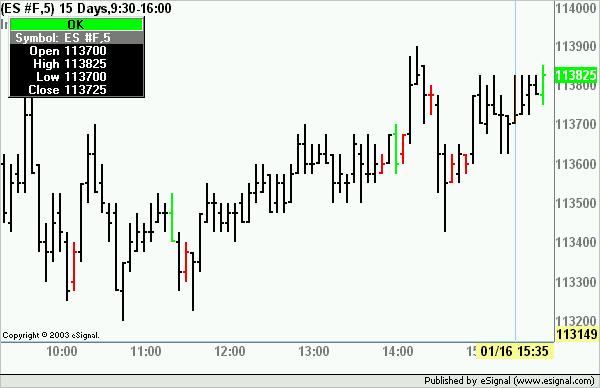
Also does anyone have an example of an EFS study that colours inside and outside bars differently to other bars?
Thanks in advance,
Runningbear
Also does anyone have an example of an EFS study that colours inside and outside bars differently to other bars?
Thanks in advance,
Runningbear

Comment