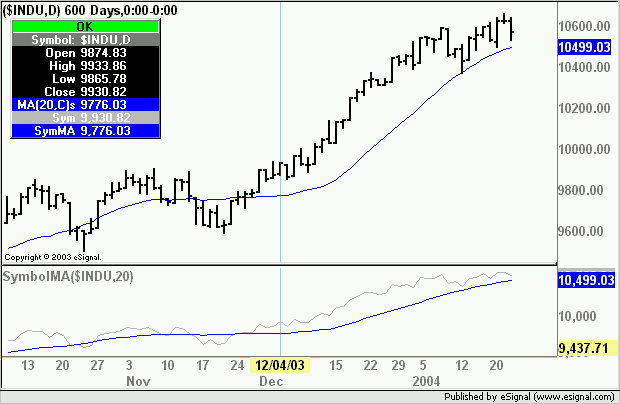
I am enjoying the multiple symbol ability of eSignal 7.5, but I have a question.
When you plot two symbols, eSignal automatically creates an additional scale. This is usually necessary because the two symbols have a price action in different ranges. For instance, if I plotted $INDU as a second symbol to DELL, another scale would be needed because the value of $INDU is around 10500, and the value of DELL is around 35.
OK, but what if I want to plot $INDU and YM H4 (the futures contract of INDU). Since these two symbols are going to be very similar in value, I would like to plot them on the same scale with the same scaling. I would like to do this so I could see a graphical representation of the spread between the two; I want to be able to look at the chart and instantly know whether the futures are higher or lower than the cash--if the ym line crosses over $indu, then I know that the future is trading higher than the cash, and conversely, if ym h4 crosses below $INDU, then I know-- instantly -- that the futures are trading lower than cash.
However, when I plot these two symbols on an advanced chart, since they are on two different scales, there is no way to get them to "line-up" properly. The Y-axis for each symbol has a different offset. In addition, the offset can't easily be lined-up because the scaling interval may be different, i.e. one symbol might be plotted at a 5 point interval (on the y-axis grid), and the other may be plotted at a 10 point interval (on the y-axis grid). Obviously, this makes it impossible to do what I want to do.
Question(s):
1. Is there anyway to plot these two symbols so they have ONE fixed scale both in offset and in scale interval?
2. If the answer is NO to #1, would it be possible to write an EFS to plot these two symbols in such a way?
Thanks for your help!!!

Comment