Announcement

Collapse
No announcement yet.

Different Price than what is really price

Collapse
X
 
  • Filter
  • Time
  • Show
Clear All
new posts

  • Different Price than what is really price

    Hey,

    I have a different price showing up in all of my different intervals for a stock. On my stock list, it actually shows the CORRECT price, and on my charts it isnt even close to the same price. Well, its like 10 cents higher than the "last". I've checked with different charting programs, and they all show the "correct" price. What would cause this? I have restarted esignal and reloaded the data with same results.

  • #2
    Hi KuJax,

    Not sure I can answer this question with the information provided. Where on the Charts are you looking for the price, on the left hand column which would show the last price?

    What symbol and intervals are you displaying?

    Let us know and we'll look into further.

    Thanks,

    Comment


    • #3


      This is a 1 minute time interval on LU. As you can see the LAST price is 4.36. 4.36 isnt even represented on this chart. What other information can help you determine the problem?

      Comment


      • #4
        KuJax
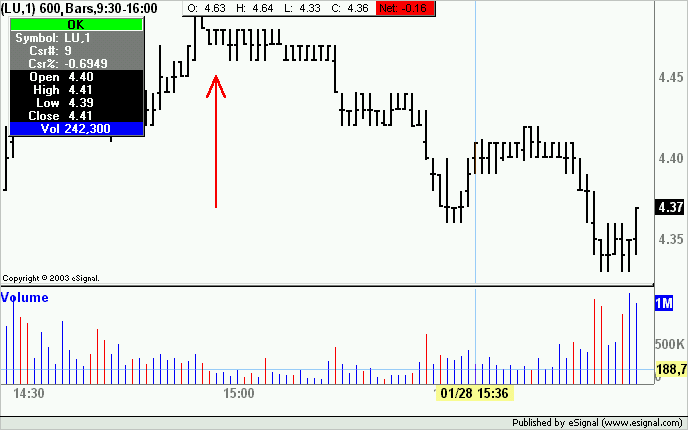
        This is the chart as you are showing it (I am on EST). The Csr# in the Cursor Window shows 29 bars past 14:30 EST which matches also the volume bar count on your chart.


        The bar indicated by the arrow is time stamped 14:59 EST. If that is the last value on your chart then the following image shows what you are missing


        What time zone are you in? Just trying to understand why you would be missing an hour. A first guess would be that you are using a West Coast time template but you are not on PST
        Alex

        Comment


        • #5
          An incorrectly set time template can certainly mimic what you're reporting. Here's a helpful FAQ on setting up Time Templates. You'll also want to double check that your PC clock is accurate and that you are set for the correct time zone.

          Please let us know if these suggestions resolve the problem.

          Thanks.

          Comment


          • #6
            Time templates? Thats interesting. I changed it, to 730 - 1400. Which is what I am, Mountain Time. My computer clock settings are correct. However, my 1 minute chart goes to 13:59 and my 2 minute chart goes to 13:58... ETC ETC. My 45 minute it stopping at 12:45. How do i just screw the whole time template thing, and have everything with from open to close? I don't believe I want aftermarket info in their either. I read the guide, and believe I set it up all correctly, but still my higher minute and even my lower time minute are missing little bits of information.

            Comment


            • #7
              KuJax
              eSignal time stamps the beginning of the period so if you set up a Time Template from 7:30 to 14:00 the last bar on a 1 minute chart will be time stamped 13:59 and on a 2 min chart the last bar will be time stamped 13:58. Your last 45 minute bar should be time stamped 13:30.
              Alex

              Comment


              • #8
                Originally posted by Alexis C. Montenegro
                KuJax
                eSignal time stamps the beginning of the period so if you set up a Time Template from 7:30 to 14:00 the last bar on a 1 minute chart will be time stamped 13:59 and on a 2 min chart the last bar will be time stamped 13:58. Your last 45 minute bar should be time stamped 13:30.
                Alex
                Right, but do i really want it setup that way?

                Comment


                • #9
                  KuJax
                  Not sure I understand what you are asking.
                  Anyhow, if you want to see stocks only for RTH then set the Start/End times in your Time Templates to 7:30/14:00. If you want to make it even easier then put a checkmark in Automatic Start/End Times and the program will take care of it.
                  Alex

                  Comment


                  • #10
                    Originally posted by Alexis C. Montenegro
                    KuJax
                    Not sure I understand what you are asking.
                    Anyhow, if you want to see stocks only for RTH then set the Start/End times in your Time Templates to 7:30/14:00. If you want to make it even easier then put a checkmark in Automatic Start/End Times and the program will take care of it.
                    Alex
                    Like... isnt it a little misleading with a higher minute chart, like a 60 minute that it will lose 60 minutes of that data right then?

                    Comment


                    • #11
                      KuJax
                      Assume that you have set up your Time Template for 7:30-14:00 MT
                      Your first bar of the day will be time stamped 07:30 and will cover the period that goes from 07:30 to 08:29. The next bar will be time stamped 08:30 and will cover the period that goes from 08:30 to 09:29 and so on and so forth. The last bar of the day will be time stamped 13:30 and will cover the period to the close of the day.
                      I fail to see where this is misleading or where you would be losing any data.
                      Alex

                      Comment


                      • #12
                        Originally posted by Alexis C. Montenegro
                        KuJax
                        Assume that you have set up your Time Template for 7:30-14:00 MT
                        Your first bar of the day will be time stamped 07:30 and will cover the period that goes from 07:30 to 08:29. The next bar will be time stamped 08:30 and will cover the period that goes from 08:30 to 09:29 and so on and so forth. The last bar of the day will be time stamped 13:30 and will cover the period to the close of the day.
                        I fail to see where this is misleading or where you would be losing any data.
                        Alex
                        hrmm... maybe i'm confused. But still in my charts, like the 60 minute is showing the wrong price, because it is only stopping data at 13:00. Right? It is showing the wrong price of what the price really is, and that could be misleading if that is the only chart your looking at, can't it?

                        Comment


                        • #13
                          KuJax
                          Please create a new 60 minutes Advanced Chart for LU. Then set the Time Template to 7:30-14:00.
                          What is the value of the Close of the bar time stamped 01/28/04 at 13:30 (you can read that in the Cursor Window)? It should be 4.37 (the settled value after market close was 4.36)
                          If you do not have a bar timestamped 13:30 then you have the Time Template set incorrectly.
                          Alex

                          Comment


                          • #14
                            Originally posted by Alexis C. Montenegro
                            KuJax
                            Please create a new 60 minutes Advanced Chart for LU. Then set the Time Template to 7:30-14:00.
                            What is the value of the Close of the bar time stamped 01/28/04 at 13:30 (you can read that in the Cursor Window)? It should be 4.37 (the settled value after market close was 4.36)
                            If you do not have a bar timestamped 13:30 then you have the Time Template set incorrectly.
                            Alex
                            Thats right. I'll look more into it. Attending the new eSignal user thing today.

                            Comment

                            Working...
                            X