Announcement

Collapse
No announcement yet.

Continuous Futures Charts

Collapse
X
 
  • Filter
  • Time
  • Show
Clear All
new posts

  • Continuous Futures Charts

    This is probably an old question and should be easy to answer for users. With my emails to support I was not getting a definite answer.

    I asked whether gaps that occur because of the roll from one month to the next are adjusted. The FAQ says the following:

    "We created the #F for futures so users can track a long term trend of the futures contracts they are following. These symbols will work in any window in eSignal, however, we recommend that you use them in daily charts for long term trend analysis."

    This implies that they adjust for gaps. How would you otherwise be able to track the long term trend?

    But on the other hand the FAQ says:

    "By their own nature, continuation charts usually have gaps at the rollover dates which will often affect any analytics that are applied to daily charts. Keep in mind that these #F symbols are designed to be a continuation of PRICES, not activity."

    So does that mean they are not adjusted? Or are they (looking at the word "usually")?

    I raised the question with support and one answer in an email was:

    "Yes, we close the gaps to adjust the prices to the current levels of activity. "

    So they do but why is the ZN #F (which is the continuous 10-year Note) showing a gap from May 27 to May 28 when it rolled from June (m) to September (u)? The gap is big because of the way interest rates are currently and any chart using the continuous contracts with any studies, etc. would be completely useless.

    Is this not an issue for any other eSignal users? It makes continuous futures completely unuseable and how are you analysing futures data over longer term periods?

    Input from users appreciated...

  • #2
    Continuous Futures

    I can't answer definitively, and I've often wondered what this term actually means. The following may help.

    Prior to expiry an index future will trade at a premium to the spot based on the 'cost of carry'. The value (or index level) of the future reflecting the cost of carry will be its 'fair value'. However, if the short-term rate is below the dividend yield (expected return) the future fair value will be below the spot value.

    At expiry, the future and spot will converge, ie they will be the same value (more or less).

    Here's an example to determine a future's fair value. It's simple to construct in a spreadsheet and via dde's will also show whether an index is trading above or below its fair value, broadly bullish and bearish, respectively.

    Futures price = spot index level + (cost of carry - carry return)
    Cost of carry = spot index x short-term interest rate x time
    Carry return = spot index x expected dividend yield x time
    Time = number of days to future expiry/365

    Assume:
    spot = 4500
    short-term rate = 4%
    dividend yield = 2.5%
    Time = 90/365

    Cost of carry =4500 x (4% x (90/365))=44.38
    Carry return=4500 x (2.5% x (90/365))=27.74
    Futures price (fair value)=4500+(44.38-27.74)=4516.64.

    Future trading at a discount:
    spot = 10,000
    rate=1%
    yield = 2%
    cost of carry=24.66
    carry return=49.32
    futures price=9975.34.

    If one uses the current 30-yr yield on US bonds (4.7%?) and it is risk-free, the futures price would equal 9907 - almost a 100 points difference (I don't know if that's a realistic observation.)

    So, yes, there are 'gaps' and I don't believe they can be realistically adjusted to accommodate long-term analysis of a future without distortion - what is the basis for 'normalisation' - stripping out all the above factors from the equation? Is it uniform or consistent, ie are extreme fair values (discounts, premiums) normalised to show these significant departures?

    If you are interested in long-term analysis, I would suggest using the spot index as a proxy; I don't think you will be far out (excepting a tiny fraction of extremes which are statistically insignificant)

    Grant.

    Comment


    • #3
      Grant, thank you for the lecture, I am aware of the technicals.

      Yes, there are gaps but the whole world adjusts them for continuous futures.

      On Bloomberg you can even select what form of adjusting you want (e.g. forward or reverse adjusting or ratio adjusting).

      A non-adjusted continuous futures contract is useless as it distorts the whole picture.

      If you want to learn more about the topic, here is an article I found through a quick google search for you:

      Back-Adjusting Futures Contracts, Bob Fulks, May 11, 2000

      Comment


      • #4
        Is there a chance of an official eSignal statement on continuous futures? As described below, the FAQ is ambiguous.

        I have to assume that gaps just stay there in continuous futures as the gap for ZN #F is still there from May 27 to May 28. Same thing if you use the ticker TY #F with a gap from May 28 to June 1 (also interesting why the electronic and pit ticker roll at different dates for the same instrument?).

        Are there no continuous futures users? These price jumps distort most trading indicators (e.g. moving averages) and if you use any of the backtesting functionality, you can forget about it because the results are worthless. To do continuous futures that way is just wrong.

        What is eSignal's position on the issue?

        Comment


        • #5
          Hi hippocampus,

          Thank you for your post. To clarify, we do not perform any adjustments to the rollovers.

          We are in the midst of creating options within the software to handle rollovers in different ways. I'm not sure that would include adjustments to the rollovers. We have seen the document that you linked to below and will take it's recommendations under consideration as we work on this project.

          Regards,

          Comment


          • #6
            This is really a surprise. By just adding the contracts together, the continuous contract is useless for charting and backtesting. Your clients must mainly be equity traders.

            There are some other sources on continuous contracts:

            *Jack Schwager (Director Futures Research, Prudential) convincingly demonstrates in his October 1992 "Stocks & Commodities" article that forward and reverse adjusted continuous contracts are the only viable choice for back testing futures series.

            *Gibbons Burke (Associate Editor, "Futures" Magazine) writes in the "Futures" July 1992 issue that reverse adjusted continuous contracts "provides the greatest realism". Other methods of linking contracts, such as "perpetual contracts", result in distortions.

            *Bruce Babcock Jr. (Commodity Traders Report Editor) writes "I use price adjusted continuous contracts exclusively in my own trading".

            *Ratio Adjusted Linking Method: This revolutionary new method of linking commodity contracts is described in detail in the June '98 issue of "FUTURES" magazine. (See "Data: Pros & Cons" by Thomas Strictsman). Ratio adjusted series never go negative and back test far superior to other methods.

            Taken from http://www.pinnacledata.com/clc.html


            More on the different linking methods from http://www.csidata.com:

            Back Adjusted Contracts. This is a continuous series built from contracts whose prices have been adjusted (either backward or forward) to eliminate the gaps between expiring and newly active contracts. The idea of adjusted contracts involves concatenating historical contracts of a given commodity into the past, while applying adjustments to smooth transitions between delivery months.

            When Back-Adjust is selected for the contract type while creating a portfolio entry or selecting a contract for charting, three options are available for the accumulation method. They are:

            Back adjust - Back-adjusting involves concatenating historical contracts of a given commodity and making price adjustments to smooth the transitions. This adjustment requires applying the raw change in price of the earlier contract with respect to the price of the current (or later) contract. For example, say your series is rolling backward through the quarterly contracts of December, September, June and March of a given calendar year for your commodity. If the price of the December contract were 100 and the price of September were 95 on roll-backward day, this traditional back-adjuster would elevate all prices for the September contract by five. This would be maintained as a delta of five to be added to all past data, beginning with the September contract, on the day before rolling from the December contract.

            Back-adjusted contracts have a tendency to have their values dip below zero, which can present problems with a variety of analytical programs. If this should be a problem for you, consider using the "Proportional Adjustment (below), detrending, or the Raise Negative Series option. The first two of these will reduce the possibility of negative values in your back-adjusted files, and "Raise Negative Series" will absolutely remove the possibility of negative values in the resulting series.

            Forward adjust - A forward-adjusted data series, like a back-adjusted series, involves concatenating historical contracts of a given commodity and making price adjustments to smooth the transitions. In a forward-adjusted contract, however, the prices of the current contract are changed to eliminate the gap between the current and recently expired contract. An important aspect to remember about forward-adjusted contracts is that current prices do not represent actual values for today's markets.

            Proportional adjust - This is an enhancement of the original back and forward adjust options. With it, UA will, at your option, proportionately adjust the history of a commodity by percentage or ratio terms, in addition to splicing contracts by adding or subtracting their relative differences into the past. Proportionally adjusted series prepared through ratio multiplications are unlikely to go negative, so there is seldom a need to elevate a series out of negative territory. Contracts are joined by increasing or decreasing successively further distant contracts by a percentage to raise or lower the entire history by the same proportion. Rounding problems, caused by attempts to preserve tick differentials of reported prices, could occasionally push a given series into negative territory.

            Because the proportional adjustment yields a much milder descending slope of long-term prices into the past, there is much less long-side trading bias that can be captured from the data. An unbiased result that offers realism should be much preferred over a highly profitable and unbelievable result that holds more contributions from inflation than from any perceived trading style or expertise.

            The idea of proportionally adjusted contracts requires applying the percentage change in price of the earlier contract with respect to the price of the current (or later) contract. Consider the above example where a five-cent difference in price between successive December and September contracts resulted in a five-cent adjustment to all past data with the traditional back adjuster. In a proportionately adjusted series, the fixed delta of five would represent a factor of 5/100 or 105% of the September price for all data in the September contract. This process would repeat at the same percentage for every contract boundary until the series ended.

            The Proportional back-adjustment principles offered here were inspired by Thomas Stridman, who discussed the idea in his article "Data Pros and Cons" in the June, 1998 issue of Futures Magazine.

            Comment


            • #7
              hippo -

              I feel your pain on this issue. However, from a real-time perspective, I don't want the prices adjusted on my #F contracts because I want them to be accurate in real time.

              I am a futures trader and write extensive EFS strategies and do a lot of backtesting. So, yes, this rollover gap is an issue. However, all of my trading is based on intra-day data (30m is my longest timeframe) and 34 is the largest MA I use, so the effect of this "artificial" gap is pretty much reduced to just the rollover day. If I have a signal setup due to that I can just ignore it if I wish.

              A much bigger issue for me, as a back tester, is the six month limitation on intra-day data. This is the thing that has me a half step away from moving to TS.

              Comment


              • #8
                This rollover price adjustment issue is an even bigger one when you start trying to look at futures contracts like oil and natural gas which roll to a new contract every month. In addition, esignal rolls these contracts 1 week before expiration but trade does not really roll then.

                Can we get an official statement from eSignal on when and how this issue will be addressed?

                Thanks.

                Comment


                • #9
                  NG & Crude can be very frustrating as the dates esignal seems to roll them on isnt consistent.

                  Comment


                  • #10
                    I do system testing, etc. in other applications and use back-adjusted contracts there.

                    But if you want to take a quick look at a longer-term chart you should at least have the option to look at the real picture.

                    And just adding the contracts together to make them continious is certainly not the real picture.

                    I am still astonished that eSignal does not provide back-adjusted prices (that close the gaps). I have to assume that most of their clients are active in stocks and don't give a thing.

                    And as I have not heard otherwise, I guess it is not a priority for them.

                    Comment


                    • #11
                      Hi folks.

                      eSignal 7.9 is currently under alpha testing. One of the main features in this version is the new Continuous Contract engine. This will allow you to create parameters for your own continous contract on any eSignal future (including international futures, where #F was not previously available). You will be able to specify the near contract (<ROOT> 1!), next contract out, etc.. (<ROOT> 2!).

                      There will be back-adjustment on the continuous contracts, as well as the ability to select the roll date using a variety of algorithmns (volume based rolls will not be in 7.9, but should be in the next version after).

                      Hope this clarifies things on what's coming up next. The beta should be released in a week or two.

                      Comment


                      • #12
                        This is great news and really important for futures traders.

                        Two questions, however:

                        1. In trying to retrieve historical data by contract (XX H4, XX M4, etc.), I find that you don't have data for very many contracts in your database although the XX #F contracts can go back a number of years. If true, does this mean that we will only be able to construct a continuous contract for the past year or so. Or are you going to restore the data for contracts extending back a number of years.

                        2. Will the continuous contract pertain to intraday data as well as daily data?

                        Thanks.

                        Comment


                        • #13
                          1. As it turns out there is a bug in Advanced Charts that doesn't allow you back access to those expired contracts unless you have specified the # of bars back in your Time Template (the bug is in the dynamic time template, it doesn't request data far enough in the past). This should be resolved for 7.9 and will not pose a problem for the custom continuous contracts.

                          2. The CC will work on both daily and intraday data. If you leave your eSignal running on the day of the rollover, the appropriate symbols/contracts will be re-requested and adjusted for you.

                          Comment


                          • #14
                            Thanks, Dion for the update.

                            I agree that this is awesome news.

                            Buhrmaster - note that intraday data is only available in eSignal for 120 days. So, for intraday charts this will only be the last few contracts.

                            That's the next huge task for eSignal as far as I'm concerned - intraday data back at least 1yr...

                            Comment


                            • #15
                              buhrmaster

                              1. In trying to retrieve historical data by contract (XX H4, XX M4, etc.), I find that you don't have data for very many contracts in your database although the XX #F contracts can go back a number of years...

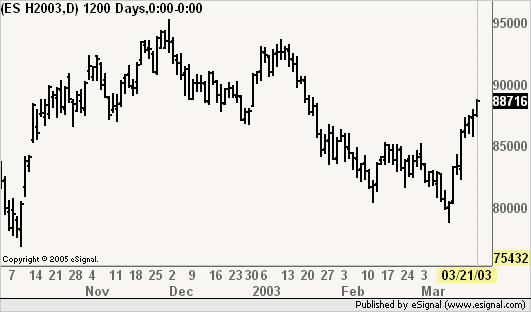
                              Keep in mind that expired contracts change symbol. For example the symbol for ES March 03 contract is ES H2003 (see attached image)
                              Alex

                              Comment

                              Working...
                              X