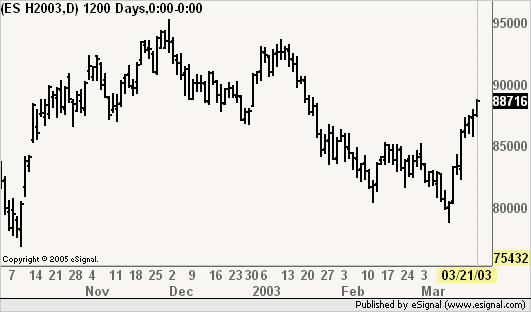
This is probably an old question and should be easy to answer for users. With my emails to support I was not getting a definite answer.
I asked whether gaps that occur because of the roll from one month to the next are adjusted. The FAQ says the following:
"We created the #F for futures so users can track a long term trend of the futures contracts they are following. These symbols will work in any window in eSignal, however, we recommend that you use them in daily charts for long term trend analysis."
This implies that they adjust for gaps. How would you otherwise be able to track the long term trend?
But on the other hand the FAQ says:
"By their own nature, continuation charts usually have gaps at the rollover dates which will often affect any analytics that are applied to daily charts. Keep in mind that these #F symbols are designed to be a continuation of PRICES, not activity."
So does that mean they are not adjusted? Or are they (looking at the word "usually")?
I raised the question with support and one answer in an email was:
"Yes, we close the gaps to adjust the prices to the current levels of activity. "
So they do but why is the ZN #F (which is the continuous 10-year Note) showing a gap from May 27 to May 28 when it rolled from June (m) to September (u)? The gap is big because of the way interest rates are currently and any chart using the continuous contracts with any studies, etc. would be completely useless.
Is this not an issue for any other eSignal users? It makes continuous futures completely unuseable and how are you analysing futures data over longer term periods?
Input from users appreciated...


Comment