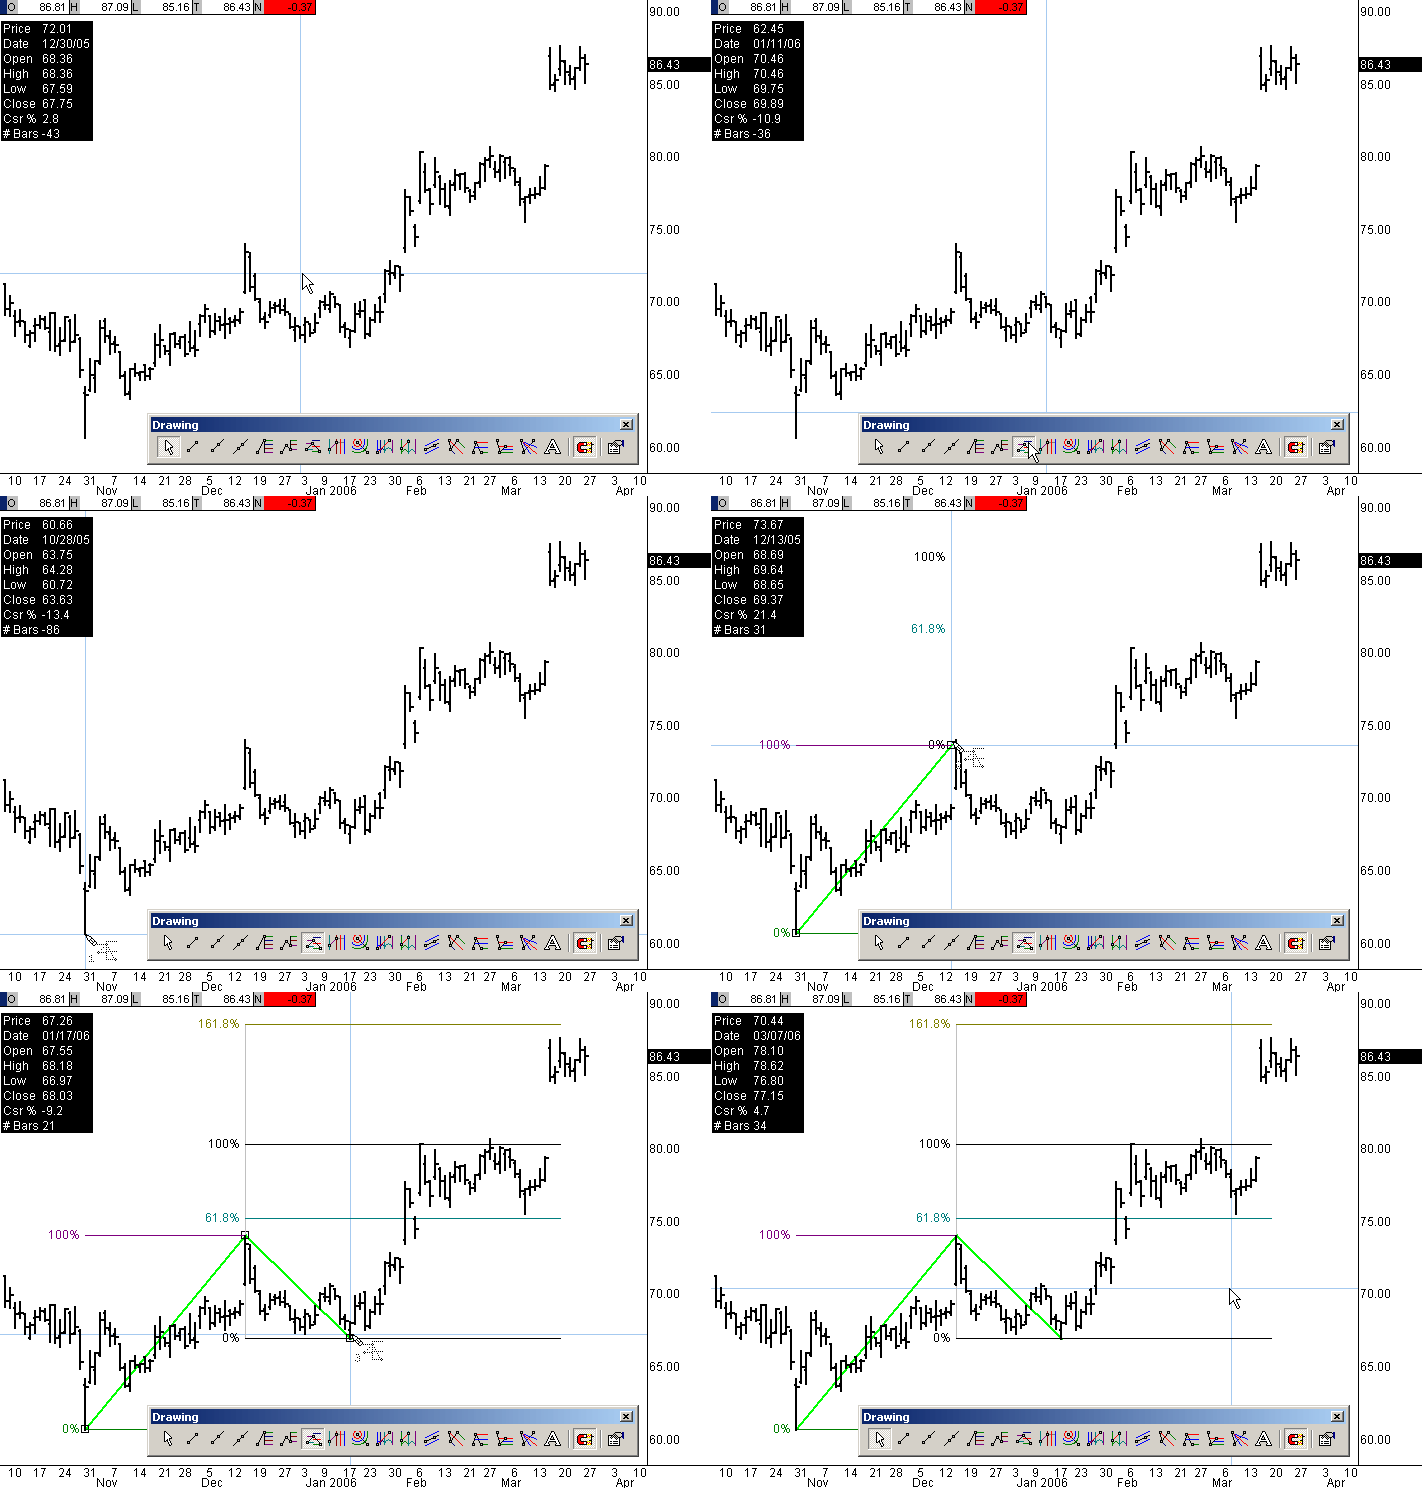
Well....I honestly never saw myself posting an image from QCharts on the eSignal forums, but as an avid user of both applications and employee of both organizations, I am happy to see QCharts get the attention it rightly deserves. I'm sure I'll see some familiar names in the coming weeks where Jay, Mike and I will do our best to bring everyone into the fold. These boards are for you...please use them....we pay close attention to our community groups.
As we get started, I thought it would be fun to mention some of the features that are unique to QCharts from a technical trading perspective. Personally, I don't take too many contrarian or counter trend trades however I've found that the % In Yearly Range field in the Quote Sheet was a nice way to filter down some high flyers.
Once this list is populated with the "ALL OPTIONABLE STOCKS" symbol list (another handy feature), I filter it for volume and price....it may be best to run this at the end of the day if you are filtering volume as not eliminate solid candidates that haven't accumulated adequate volume. Once that is done, sort the list based on % In Yearly Range. Experiment with your Fibonacci Extension tool and watch the behavior at the key levels. Have fun....

Comment