Announcement

Collapse
No announcement yet.

Data Integrity - Splits, gaps, spikes, whatnot.

Collapse
This topic is closed.
X
X
 
  • Filter
  • Time
  • Show
Clear All
new posts

  • In looking deeper and discussing this with the engineers, many of the discrepancies are due to the bandwidth issues seen on the feed feeding the Continuum servers.

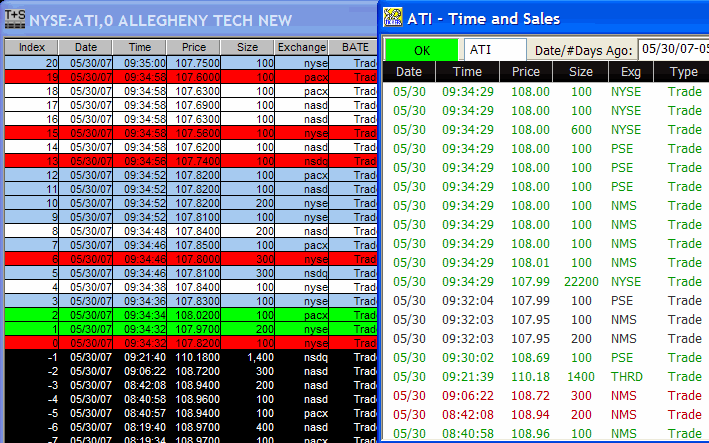
    ATI is a great example of this. Here's a look at yesterday's open. QCharts 5.1 is on the left, eSignal is on the right. You'll notice there are 15+ trades that came through on the eSignal side before the QCharts 5.1 servers delivered their first tick.


    Regarding the question which chart should you trust (Daily or 390)? I would say Daily is more reliable as it is built on the official exchange summaries that are sent at the end of the day.
    Regards,
    Jay F.
    Product Manager
    _____________________________________
    Have a suggestion to improve our products?
    Click Support --> Request a Feature in eSignal 11

    Comment


    • Thats interesting on eSignal showing 15 ticks before continuum picked up its first. But, what I'm seeing is showing up on both 5.1 & Beta charts.

      For clarity, I do NOT use a 390-minute chart (except for days the Daily will not populate the ADX indicator). I am posting it only for ease of comparison.

      Carol

      Comment


      • Here's why I sometimes use a 390-minute chart for trading: the ADX will not always populate on a Daily Chart.

        fyi,
        Carol
        Attached Files

        Comment


        • Thanks for the clarification. Does this ADX drawing problem also occur in 6.0?
          Regards,
          Jay F.
          Product Manager
          _____________________________________
          Have a suggestion to improve our products?
          Click Support --> Request a Feature in eSignal 11

          Comment


          • Jay,
            I'm not seeing it on Beta today - however, yes, I've had the same problem there as well.

            This is not a thing that happens on all symbols - typically STLD, NOV, SHLD will happen regularly. Other symbols happen erratically for me. Again, on both 5.1 & Beta as well.

            Carol

            Comment


            • Broken ADX

              Jay,

              I, too have seen the ADX problem on 5.1, but so far have not seen it on 6.0 beta. I reported the problem several months ago and sent a workspace to Carl who was able to recreate the problem. By changing one of the parameters of the ADX study, the problem would go away (at least on that chart, but obviously, this is a coding error). I have seen times where the ADX would display correctly until I did something to the window such as change its size, but usually, it won't display at all. I always get it on STLD, ESRX, EMC, and CHK.

              My 2¢

              Jim
              When buying and selling are controlled by legislation, the first things to be bought and sold are legislators.
              -- P.J. O'Rourke

              Comment


              • Bob or Jay,

                Stocks that split today don't seem to be charting correctly on D and W charts. I have restarted QFAI and QC this morning.

                Symbols with this split problem are: SRCL, NRG, and GEO.

                Thanks for your help!
                T

                Comment


                • Regarding your GS charts.... both the Daily and the 390 are correct! The question to answer is how can they be both correct? Well, I must say that Larry's explanation in this thread answers it beautifully.
                  Jay,
                  Ok, from Larry's explaination, I get it that the Intraday charts are set for a hard Close at 16:00 and the Daily charts are set for a hard Close at 16:00 plus a few minutes.

                  But, what about the Open? Are the Intraday's also set to a hard Open at 09:30 and the Daily at 09:30 +/- a few minutes?

                  Example: ESV - see May 15 candles (originally posted May 16) - the Daily, Intraday, and T&S all show very different Opens and tell very different stories.

                  Again, I am not trying to be smart. I simply look at the data and get 3 very different pictures and just don't know how to interprete the data.

                  Thanks,
                  Carol
                  Attached Files

                  Comment


                  • I always get it on STLD, ESRX, EMC, and CHK.
                    A folow-up to Jim's post - I tried ESRX, EMC, & CHK and they also will not paint the ADX for me, eitherl.

                    One other note if it helps your troubleshooting - just like for Jim, sometimes STLD will initially paint the ADX - but, as soon as I touch the chart, it disappears.

                    Just an FYI,
                    Carol

                    Comment


                    • Tom,

                      The splits are in both the CorpActs.INF and CorpActs.UNF and the D & W charts look corrected for the splits but no trades have been recorded as yet today.

                      ~Bob

                      Comment


                      • Oh right Bob, thanks for that. There is still that odd bug that shows a closing price for today before the trading day starts; that is what I was seeing. (I think I should move to 5.1.0.21.)

                        Thanks again,
                        T

                        Comment


                        • Originally posted by ckelly
                          But, what about the Open? Are the Intraday's also set to a hard Open at 09:30 and the Daily at 09:30 +/- a few minutes?
                          Intraday charts are hard coded to open at a specific time, and in the case of U.S. stocks this is 9:30am.

                          The Daily charts simply use the current snapshot data that is displayed in a Quote Sheet or Snapshot bar. This snapshot data is initially set by the first regular (non-premarket) trade. Periodically throughout the day the Continuum servers will receive a summary message from the feed that says "this is what you should have for the Open, High, Low, Volume, etc." If any of Continuum's fields differ from this summary message, then they will be changed to equal that summary.

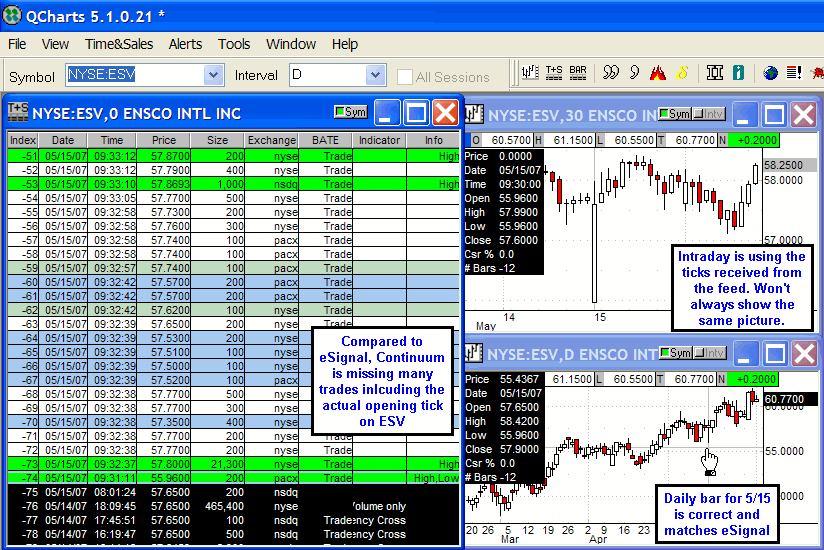
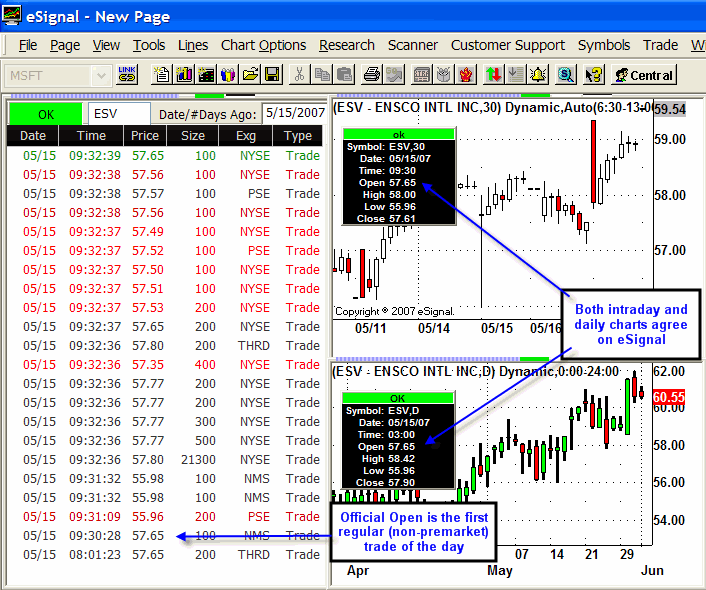
                          In the case of ESV, this is the result of dropped trades on the feed coming into Continuum. To see this first hand, first take a look at what eSignal is showing for ESV...


                          Now, QCharts 5.1...

                          Regards,
                          Jay F.
                          Product Manager
                          _____________________________________
                          Have a suggestion to improve our products?
                          Click Support --> Request a Feature in eSignal 11

                          Comment


                          • ADX Issue

                            I did duplicate an odd behavior with the ADX (5,13) on STLD for QCharts 6.0. The ADX line actually flat-lined on a daily chart while the DI lines remained intact. I haven't seen anything disappear yet, but I'll continue to try to look at it.

                            In either case, I'll add it to the QCharts bug list.
                            Regards,
                            Jay F.
                            Product Manager
                            _____________________________________
                            Have a suggestion to improve our products?
                            Click Support --> Request a Feature in eSignal 11

                            Comment


                            • I don't typically reference the T&S (I'm more of a chart trader)....can someone help me understand what the Info comments are telling me?

                              What appears on the charts as a rogue trade shows as "Low" in T&S. This is followed by the same line data and the Info is "Inserted."

                              My first thought was that the "Low" was some poor soul put in a market sell order and got taken advantage of. But, with the immediate next trade seemingly the same but labeled "Inserted," I'm confused as to what really happened.

                              Can anyone explain what the data is telling me?

                              Thanks,
                              Carol
                              Attached Files

                              Comment


                              • More on the ADX (Yikes!)

                                Hi Jay,

                                That explains why the label for the study is cut in half for me on 5.1 - I set the ADX line to the background color. When it is broken for me, the lines sort of devolve into two very thin red lines that run through the label. I saw the same thing that you did on my 6.0 beta (not the most recent). For me, that is usable, but obviously not correct.

                                Jim
                                When buying and selling are controlled by legislation, the first things to be bought and sold are legislators.
                                -- P.J. O'Rourke

                                Comment

                                Working...
                                X