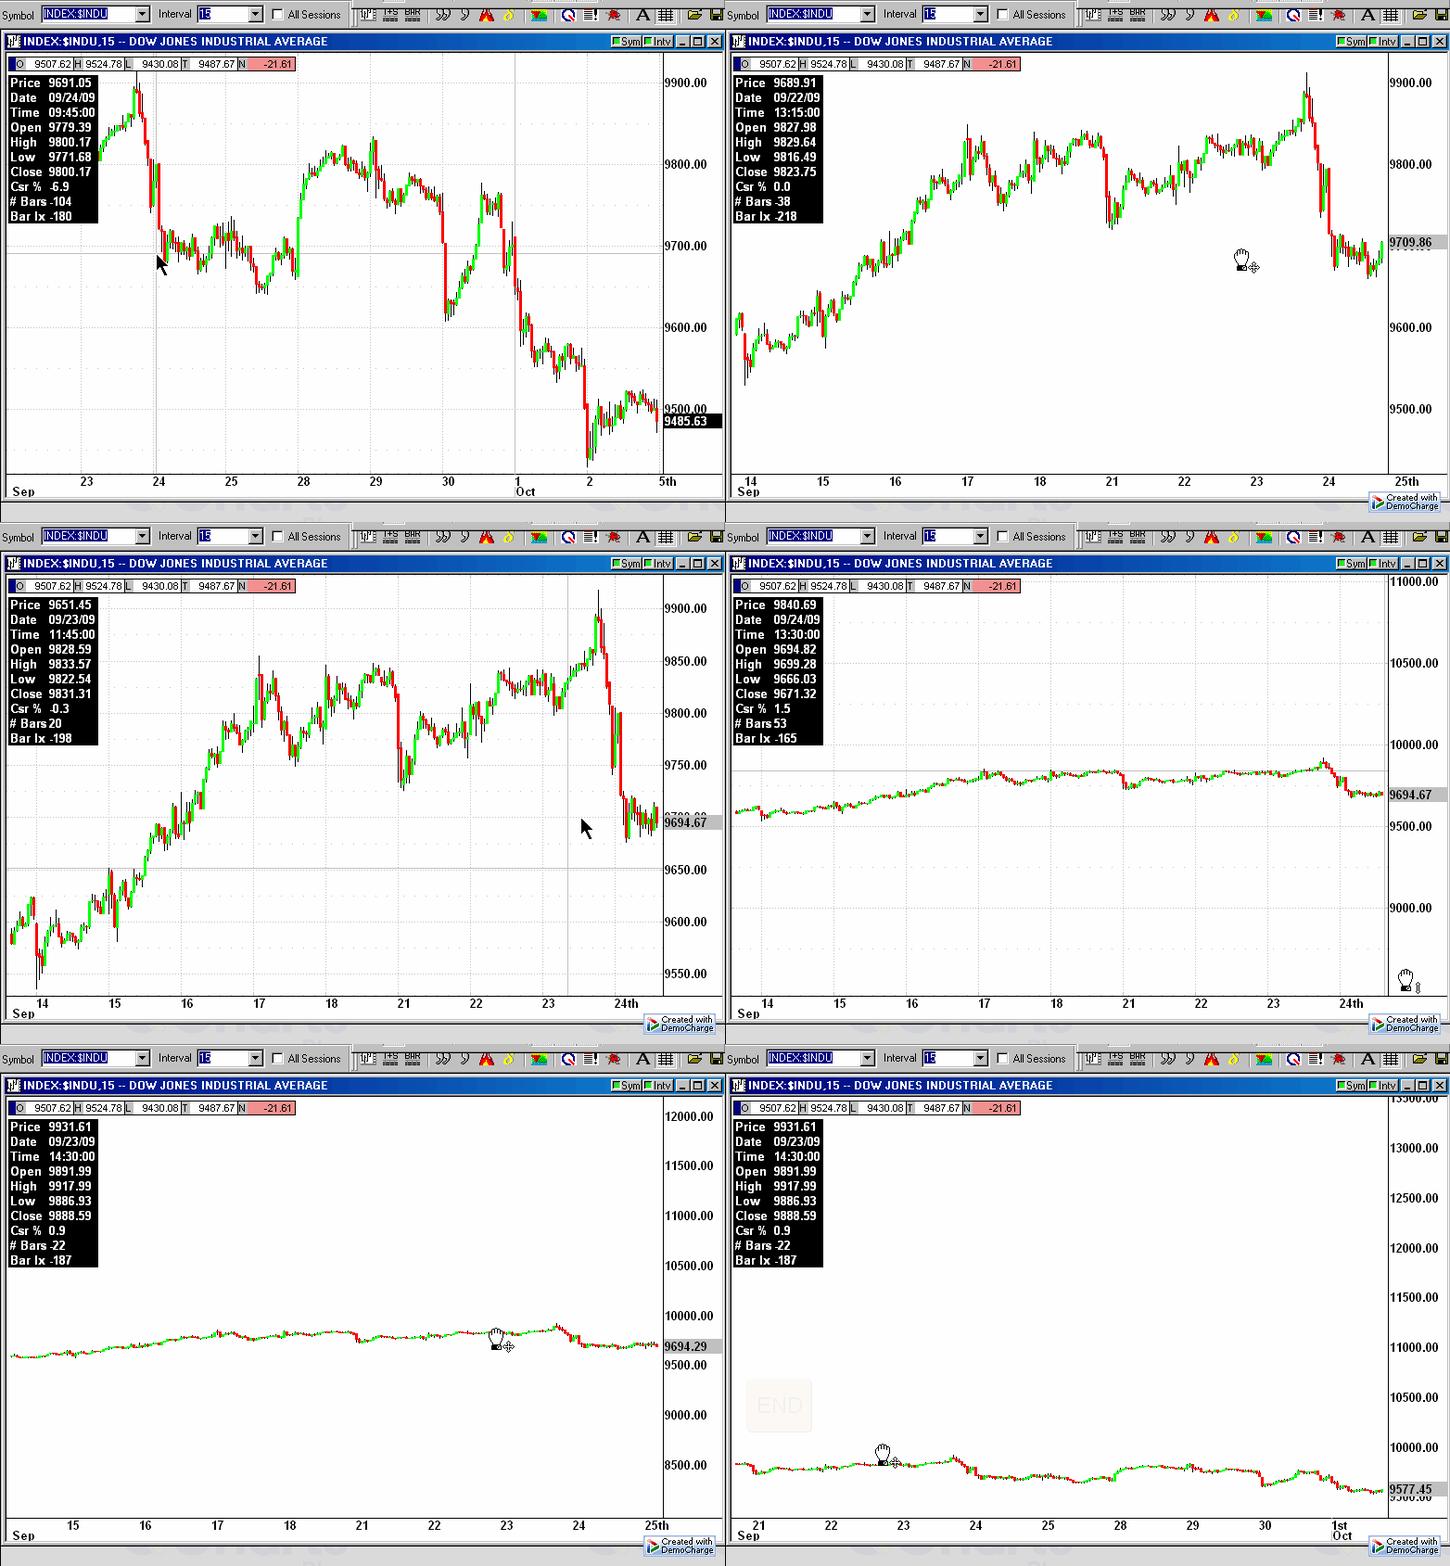
This is a big bug of QCharts 6.1. The chart becomes unusable without auto scale.
Let's use Dow index as an example. Open a 15 min Dow chart. Adjust the chart so that the date on the right edge of the chart is 9/23/09. Turn on auto scale price to make sure the price scale numbers are correct, then turn it off. Move the chart to the beginning of September by drag and drop. The direction of the mouse should be at an upperward 45 degree angle. The chart looks like end.bmp.
The last price 9560 is above 9900, the lowest price level 9700 should be about 9300 actually. The numbers on price scale don't match real data. They should change as displayed data changes. A drag of mouse in the vertical direction can correct the problem, but this is a bug anyway. If you do the same in 6.0.3, the chart is correct


Comment