Announcement

Collapse
No announcement yet.

Volume charts mess in MultiCharts

Collapse
X
 
  • Filter
  • Time
  • Show
Clear All
new posts

  • Volume charts mess in MultiCharts

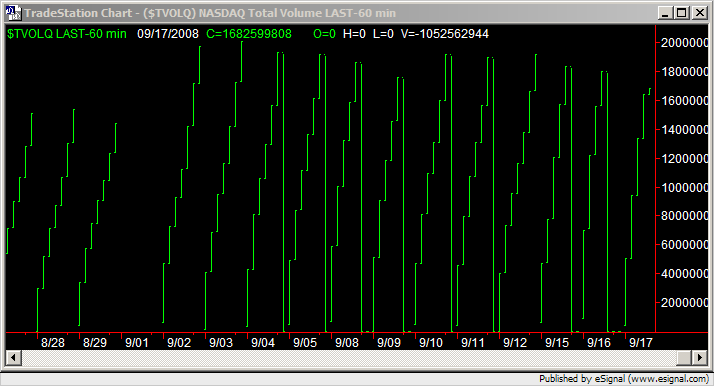
    I am very grateful to the eSignal team for fixing this ongoing issue!

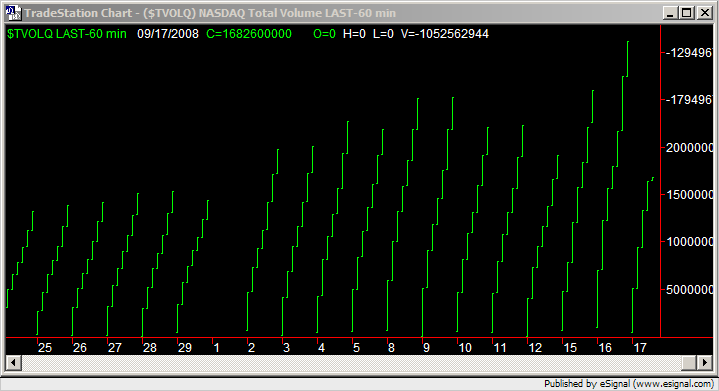
    However in Multicharts I am still having a hard time.

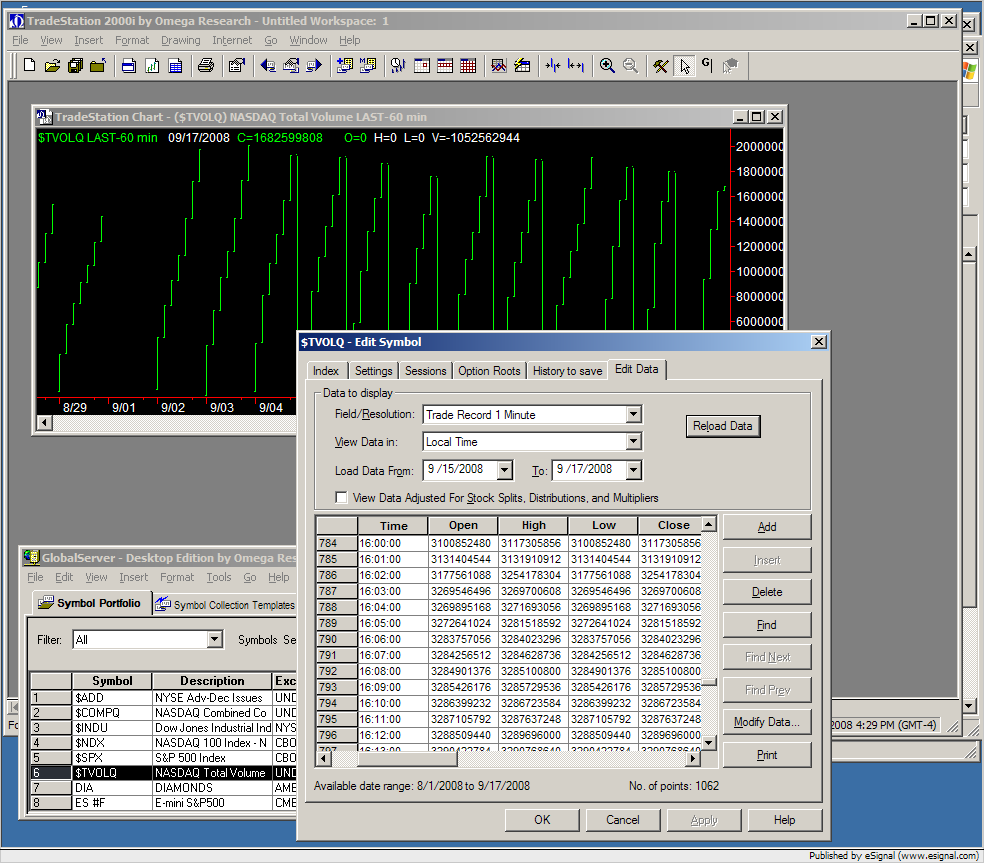
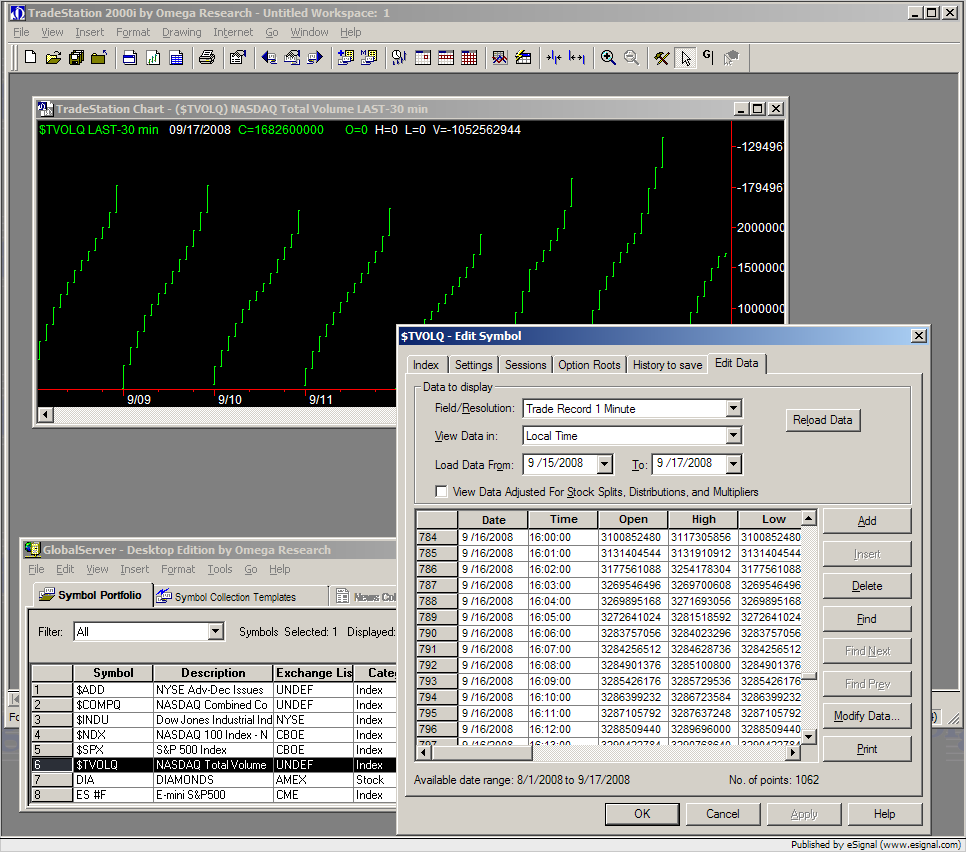
    I will post these same screen shots in the Multicharts forum for comment.

    ---> Meanwhile, any suggestions?


    Thanks,
    Bob
    Attached Files
    Last edited by RobotMan; 09-17-2008, 10:24 AM.

  • #2
    We don't have any suggestions that would help you with this except to please continue posting to their forums or calling them directly in hopes that they will make the necessary corrections in the code that would allow the volume to display correctly.

    Now I've spoken with their Technical Support who was in turn was going to talk with the Engineers about the charting and what can be done.

    Hopefully we'll get a call back soon with some type of resolutions. If and when I hear back I'll post here.

    AveryH
    eSignal Support

    Comment


    • #3
      Bob
      Try changing [in the Quote Manager] the Price Scale Settings for that symbol from As Is to 10000.
      This change fixed the same issue in TS2k as you can see in the screenshots enclosed below (top is As Is and bottom is 10000)
      Hope this helps
      Alex


      Comment


      • #4
        Hi Alexis,

        I have already tried fiddling with the Price Scale settings in MC and it does nothing for this problem. In TS2ki, it wasn't the Price scale settings that was changed, it was the price multiplier. See TS2ki KB #647:
        http://www.tradestation2000i.com/sea...DocumentID=647

        I am very familiar with this fix and it is not available in Multicharts.

        I have brought this up (the thing about KB647) with TSSupport (MultiCharts) and they said that "whatever data that comes in is the data that is displayed". Basically pointing the finger at eSignal data from the Data Manager.

        I will relay this info again to the Marina in the support forum if I am directed to try a fix with the Price Scale. Since it seems that the $TVOLQ and $TVOL data coming in is fine inside of eSignal Charting, I would assume that MC is not reading the db correctly now somehow.

        Thanks very much!
        Bob
        Last edited by RobotMan; 09-17-2008, 01:21 PM.

        Comment


        • #5
          Bob

          In TS2ki, it wasn't the Price scale settings that was changed, it was the price multiplier.
          When I captured those screenshots I did not use the Multiplier but I simply changed the Price Scale setting in GlobalServer.

          ...they said that "whatever data that comes in is the data that is displayed". Basically pointing the finger at eSignal data from the Data Manager.
          Based on what I am seeing that does not appear to be the case (at least in in TS2k) As you can see in the following screenshot the data is coming in correctly in GlobalServer but is plotted incorrectly when the Price Scale is set to As Is (and plotted correctly when I change the Price Scale to 10000)
          Alex


          Originally posted by RobotMan
          Hi Alexis,

          I have already tried fiddling with the Price Scale settings in MC and it does nothing for this problem. In TS2ki, it wasn't the Price scale settings that was changed, it was the price multiplier. See TS2ki KB #647:
          http://www.tradestation2000i.com/sea...DocumentID=647

          I am very familiar with this fix and it is not available in Multicharts.

          I have brought this up (the thing about KB647) with TSSupport (MultiCharts) and they said that "whatever data that comes in is the data that is displayed". Basically pointing the finger at eSignal data from the Data Manager.

          I will relay this info again to the Marina in the support forum if I am directed to try a fix with the Price Scale. Since it seems that the $TVOLQ and $TVOL data coming in is fine inside of eSignal Charting, I would assume that MC is not reading the db correctly now somehow.

          Thanks very much!
          Bob

          Comment


          • #6
            Bob
            Here is another screenshot showing the same exact data in GlobalServer but the correct plot in TS after I changed the Price Scale
            Alex

            Comment


            • #7
              BTW, I'm glad I don't use TS2K anymore. Look at your data (High of row 784) and the chart price scale (on 9/16 it was -117657296) Yikes.


              Bob
              Los Altos, Ca
              Attached Files

              Comment


              • #8
                Hi Alexis,

                I have been dicking around with this for I don't know how long today and all of a sudden --- It Worked. I must have clicked the magic tab, because I have tried and failed to make this thing go. I am a very happy man today thanks to your suggestion, and of course, my incredible open mindednes
                But I did continue to mess around and so, now I will make Marina happy also.

                Thanks so much!
                Bob
                Los Altos, Ca
                Attached Files

                Comment


                • #9
                  Bob
                  You are most welcome
                  Alex


                  Originally posted by RobotMan
                  Hi Alexis,

                  I have been dicking around with this for I don't know how long today and all of a sudden --- It Worked. I must have clicked the magic tab, because I have tried and failed to make this thing go. I am a very happy man today thanks to your suggestion, and of course, my incredible open mindednes
                  But I did continue to mess around and so, now I will make Marina happy also.

                  Thanks so much!
                  Bob
                  Los Altos, Ca

                  Comment


                  • #10
                    Multicharts confirms there is a bug in the application that when volume exceeds 2.1 billion share the buffer overload sets to 0 cauing the red bar to appear. They plan to have it corrected in the next release slated for later this year.


                    AveryH
                    eSignal Support

                    Comment

                    Working...
                    X