Announcement

Collapse
No announcement yet.

Advanced Charting Methods & Ideas

Collapse
X
 
  • Filter
  • Time
  • Show
Clear All
new posts

  • Re: Some simple tools

    Me like Linus. I have 1093 by Dec 11


    Originally posted by linus71
    Jeff, I like your merged MACDs.

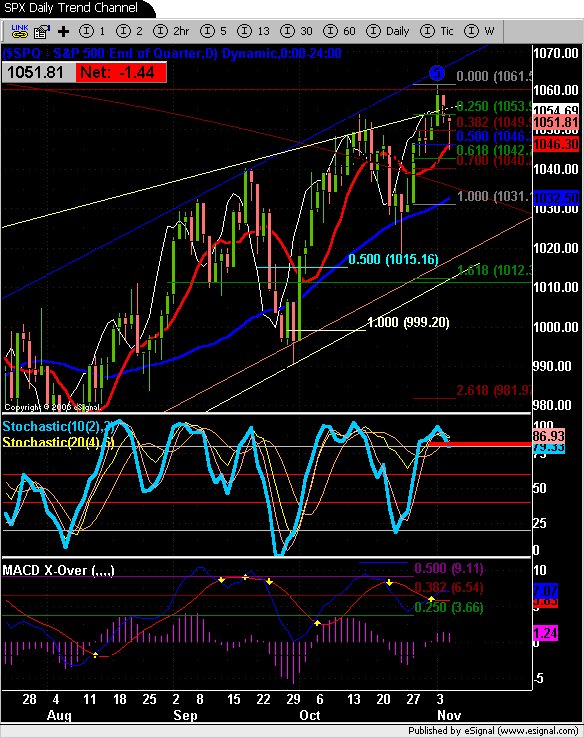
    I found this weekly chart of the SPX very interesting:
    I used the 10 week and 50 week SMAs,
    a regression trend channel drawn from March 2000 to the low of November 2002,
    a Fib extension,
    and a MACD without much consideration....
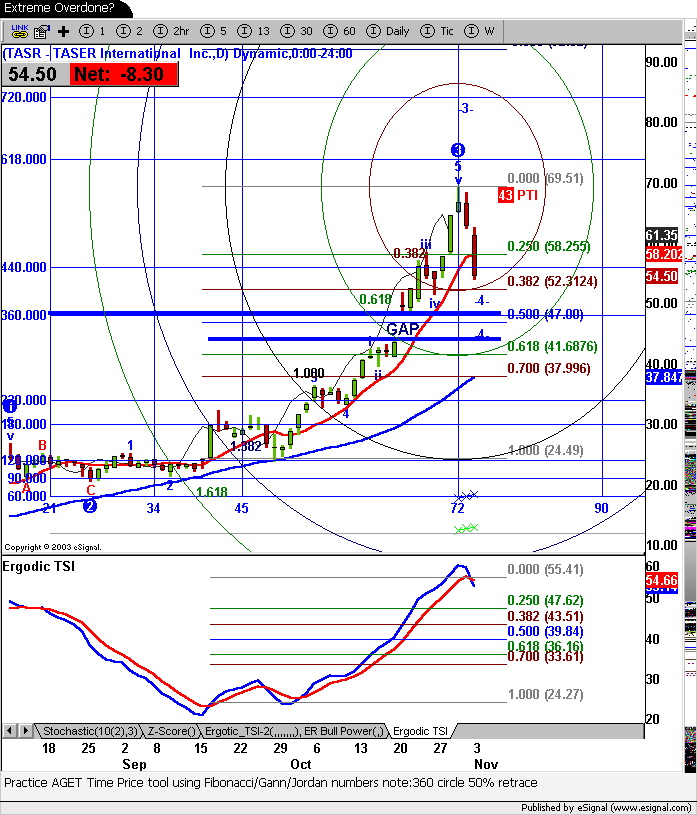
    What I find noticeable is how the prices go along the Fibonacci circle line.
    Maybe the uptrend can last until 1094 points in January 2004?
    Linus
    -------

    Comment


    • Classic


      Fabrizio L. Jorio Fili

      Comment


      • Great to see you Linus!!

        We missing your charts!!
        Fabrizio L. Jorio Fili

        Comment


        • Fabrizio... from one GET guy to another, nice work! - marc
          Marc

          Comment


          • Overview of the AGET Time and Price Squares tool

            >>>Originally posted by fabrizio
            Jeff , Linus , Marcus

            Do not like to bother but it might puzzle you those...:
            (I am into it)
            <<<

            Hi Fabrizio, Nice FDC chart, it looks like you have the trade
            figured out. Good Luck! The rest of your comment
            is too cryptic?<g> I haven't figured out how to
            use the new get time price tool yet.

            Nice charts........thanks.
            I'm still watching the volatility index and SP100
            ~j
            Last edited by JJordan; 11-03-2003, 06:40 AM.

            Comment


            • Hi Fabrizio, Nice FDC chart, it looks like you have the tradefigured out. Good Luck! The rest of your comment
              is too cryptic?<g> I haven't figured out how to
              use the new get time price tool yet.

              Nice charts........thanks.
              I'm still watching the volatility index and SP100
              ~j
              Marc , Jeff
              Thanks
              YesFDC was a nice Little Risky- but- not- so- much operation.
              Is on is way, quite and nice. I do not make lot of share ( almost zilch) but this was interesting!

              The rest is a powerfull geometrical pattern : very beautifull for simmetrical in time and in proportions ( Fibo )

              T&P Square is not complicated : a curios gentleman like you will have a great fun experimenting his own settings and Ideas!! And with magister maximum Marcus tutoring, even the most complicated turns easy!

              I saw your focus attention on S&P 500 and your $VIX/$VXN Index...nice.
              Good luck to you Jeff
              Last edited by fabrizio; 11-03-2003, 10:03 AM.
              Fabrizio L. Jorio Fili

              Comment


              • Overview of the AGET Time and Price Squares tool, con't.

                cool...Thanks Fab... This chart doesn't look so risky?<g>

                ..I'm glad to have so many pioneers like Marc around.<g>
                My first application the time/price squares


                My previous look atTASR
                Last edited by JJordan; 11-03-2003, 05:17 PM.

                Comment


                • pattern matching, con't---LOOK NO FIBS---

                  Originally posted


                  ...this is not ascii art!....or is it?
                  Last edited by JJordan; 11-04-2003, 06:04 AM.

                  Comment


                  • I thought it was MO (Phillip Morris, or whatever it is called now) cuz it looks like their camel picture... thanks for the smile!
                    Marc

                    Comment


                    • Trading the 40 looking for trend explosion...

                      Trading the charts makes you have expectations......
                      However, the outcome is always a surprise. For better
                      or worse it keeps you honest to the respect that chance warrants...
                      ..All's well that ends well, otherwise be cautious!<g>


                      Just another interesting stock to watch long term....
                      I think it's easy to measure the potential downside but not the
                      upside on this one......surprise me. Hard fight if the
                      market rollsover this am? Maybe earnings report tonight?

                      Other chart of interest TASR getting a 4 bounce/ or reversal?
                      ~j
                      Last edited by JJordan; 11-05-2003, 07:25 AM.

                      Comment


                      • Applying Signal Alerts

                        Every indicator leads to a signal alert.....then another
                        Note 3-3ma and Price now converge 40ma.


                        Let's put the SP100 in perspective (zoom) with the SP500


                        ~j

                        Last edited by JJordan; 11-06-2003, 04:33 AM.

                        Comment


                        • Candlestick measurements.

                          I think the risk increases with every successful hammer
                          until we get a failure to new heights and reversal......
                          The last hammer looks less significant on SPX chart
                          from previous post. Some may call a hanging man?

                          Stochastics remain overbot and in bullish sideways trend
                          on the daily chart. It's been a long rally...likely to continue
                          until interest rate hikes or something sobers speculators.
                          JMO,
                          ~j
                          Last edited by JJordan; 11-07-2003, 08:22 AM.

                          Comment


                          • Re: Candlestick measurements.

                            Originally posted by JJordan
                            I think the risk increases with every successful hammer
                            until we get a failure to new heights.
                            Some may call a hanging man?
                            ....follow-up, not much movement...

                            I think 1040 is a psychological level as well as light support.
                            Watching the MACD also....the market has been resilient?
                            ~j

                            Comment


                            • Re: Applying Signal Alerts

                              Let's place our bets.....the market is preparing to
                              tell us it's next whim.


                              Three options: rollover, move higher, wiggle then decide<g>

                              Comment


                              • Interesting Times, Interesting Charts...

                                Tracking interesting charts.....Finding tradable stocks is
                                a hobby of mine. Knowing a little about fundamentals
                                is dangerous for a technical trader. Opinions about market
                                valuations almost always causes a trader problems when
                                judging a charts performance against perceived reality.
                                Just thinking out loud.........................

                                Comment

                                Working...
                                X