Announcement

Collapse
No announcement yet.

Advanced Charting Methods & Ideas

Collapse
X
 
  • Filter
  • Time
  • Show
Clear All
new posts

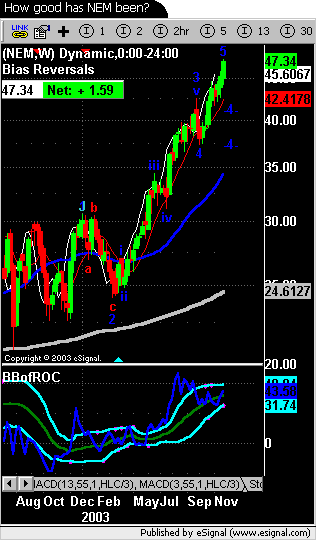
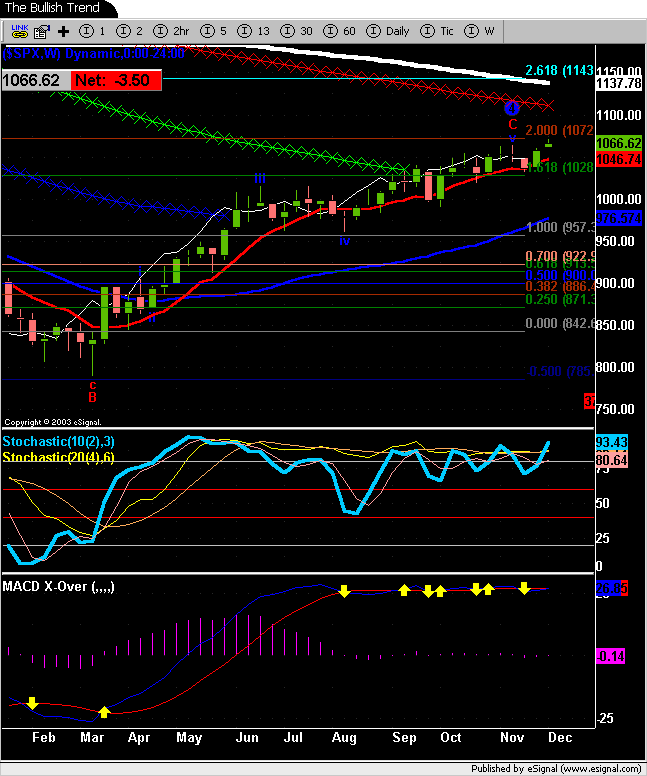
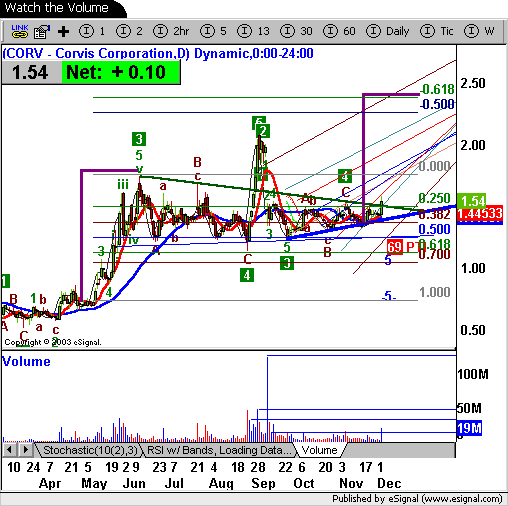
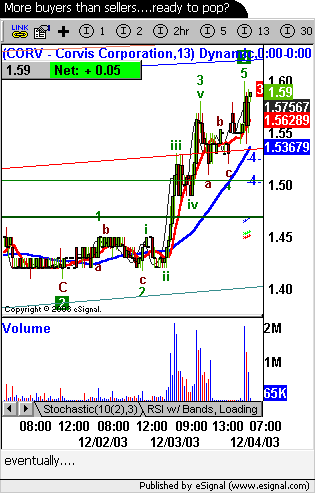
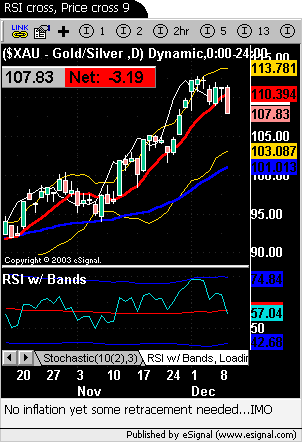
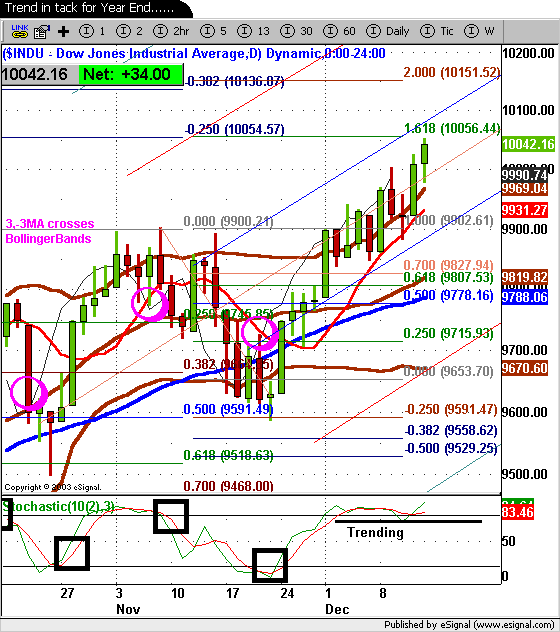
  • Charts of Interest looking at ROC different paces

    Looking at things in similar ways gives depth to methods.

    The e-mini futures on open.....using 2 minute trading


    Last edited by JJordan; 11-28-2003, 06:26 AM.

    Comment


    • Bullish start...light volume trading day.

      Going Higher?


      Keep your eye on the ball.....


      Let's compare to the SP500 (cash) on our Daily chart w/ MACD
      Last edited by JJordan; 11-28-2003, 08:32 AM.

      Comment


      • 2003 EXTREME BULLISH YEAR

        Season's Greetings to All.....May Blessings overwhelm
        the Righteous.


        Best Wishes,
        Jeff Jordan
        IN-GOD-WE-TRUST.COM

        Comment


        • Re: Consolidation Patterns

          Originally posted by JJordan
          ....watching volume with interest.There may be better charts....but the patterns are
          the same....maybe this stock will move?
          Still needs help as commented before, 4 breakout target
          next year? A difficult stock...I think a survivor? JMO
          ~j


          Let's watch the volume again...maybe she'll break?


          Recognize the pattern?
          Last edited by JJordan; 12-04-2003, 07:06 AM.

          Comment


          • Confirming signals

            When all the indicators work the picture is easier to follow.


            ~j

            Comment


            • JJ, old buddy

              Do you have any entry and/or exits dfined for that chart?

              Comment


              • Hi Dave,

                You know I trade the price/ moving average crosses. In a bullish
                market I watch the 3/8 retracement otherwise look for support @
                the 50% fibonacci. I had to put the 25% retracement back on my
                charts when the bull market started otherwise I ignore those
                levels. I'm not calling a top, I'm just expecting some profit taking
                before E.O.Y.......I'm more interested in scalp trading now.

                Yes, I'm back trading futures at IB.....but, I'm very busy
                now that I'm back in the contracting business

                entry/exit is usually price cross 9ma for me, then look for 40ma
                or 50% retrace...you pick the interval.

                ~j
                Last edited by JJordan; 12-05-2003, 10:51 AM.

                Comment


                • http://share.esignal.com/ContentRoot/FJF4/snapshot-157.png
                  Jeff your skills are fantastic.
                  God blessed you man....
                  Fabrizio L. Jorio Fili

                  Comment


                  • Re: Reply to post 'Advanced Charting Methods & Ideas'

                    Thanks for the entry exit ideas. Maybe we could get a dialogue going on the
                    signals this method generates - it seems we have a lot of users interested
                    in specific trading systems and you seem to have been particularly generous
                    with your posting in the past.

                    PS - I heard from our old pals b and d in the last week, must be something
                    in the air. If Dan sends me an email I will know something is up for sure.
                    28 lovely inches (yeah right) of white stuff here - need any out your way?
                    >
                    > ~~~~~~~~~~~~~~~~~~~~~~~~~~~~
                    >

                    Comment


                    • Signals ^ Methods

                      Here's a couple basic signals in my book. The RSI
                      above/below 50, definitely one of my favored.
                      Again Price crossing the 9MA. I follow these methods
                      in relation to the movement of the 40MA inwhich,
                      I determine the trend to trade.


                      Hi Dave, there are existing formulas around that can be
                      tweaked to preferences. A simple color bar works...
                      Stochastic crosses, MACD crosses, BB's etc.
                      People always say simple is best?

                      ~j

                      Comment


                      • Re: 2003 EXTREME BULLISH YEAR

                        Good news for the world and freedom loving people
                        as justice comes to those who embrace violence and the
                        world rejoices in the defeat of an evil.


                        The world is a better place today....

                        ~j

                        Comment


                        • Hi JJ , for sure the world is a better place now:

                          Just curious i,ve seen a lot of your posts and you always seem to use the 10,2,3 stochastic setting - why that setting asa poosed to the 14,3,3
                          How do you use it in your trading scheme ?

                          Comment


                          • Stochastics

                            Hi Silver,

                            14,3,3 is a good setting, it's just preference and personal
                            experience. 10,2,3 I know it will show me a trend and give me a
                            reliable signal @ 20/80. I look for sideways action using
                            this setting.

                            You may try a 5,3,3 another used setting....faster than above.

                            Something like 6,4,10 or 6,8,10 gives some good crossover signals

                            ~j

                            Comment


                            • so how do you get yourself into the market when it's trending isn't that where most of your profits are made - since as on the pic you put up 10,2,3 is flat when trending what do you use to take advantage in those circumstances?

                              Comment


                              • Stochastics

                                Hi,

                                Let me clarify myself.<g> I use the stochastics like everyone
                                it tells me when the stock is in the overbot/oversld area (80/20)
                                A trend can be in overbot above 80 or below oversld 20.
                                When the trend is strong the stochastic indicator goes sideways.
                                Your new signal will be when the stochastic crosses the 20 higher
                                or the 80 breakdown lower.

                                This is primarily how I use the stochastic. So now what are
                                your other indicators saying? Are you waiting for a MACD cross?
                                Is RSI rising or falling, etc......Where is the 40ma?

                                Here is the other way to use a stochastic signal....this is the
                                6,8,10 crossover signal .....I just found it a good setting
                                for this type of trading signal.

                                It's just one tool. Several ways to use...

                                ~j
                                Last edited by JJordan; 12-15-2003, 10:02 AM.

                                Comment

                                Working...
                                X