Linus
Use the Text Tool and select Wingdings as the font.
To determine what keystroke or keystroke combination corresponds to each Wingding use Character Map applet in Windows
Alex
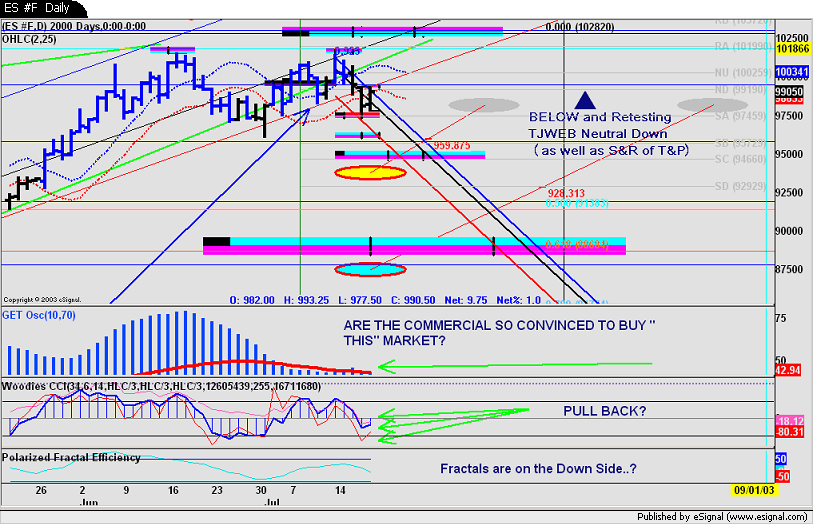
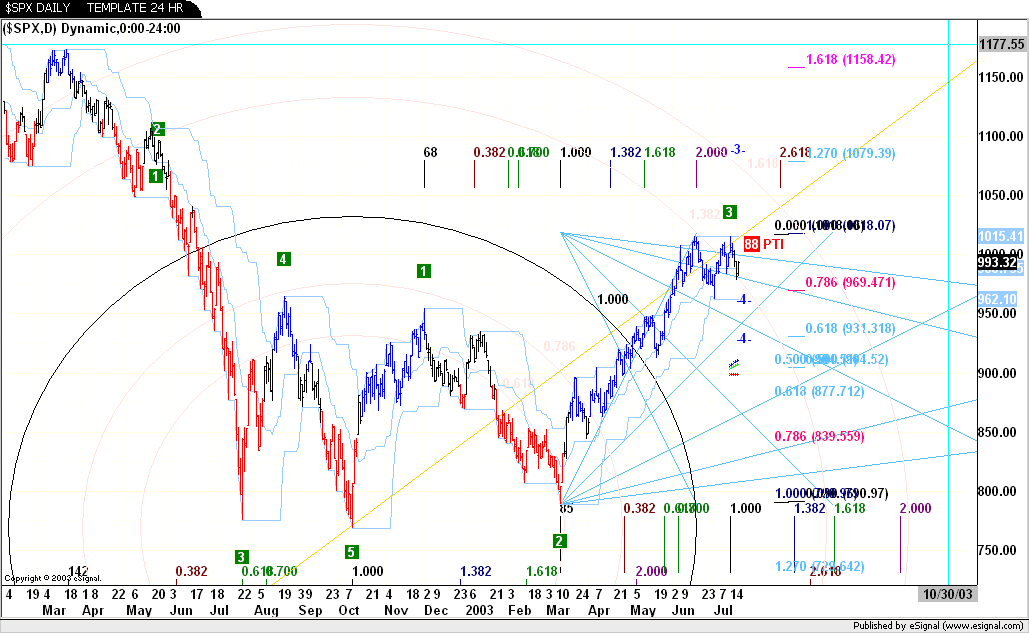
I wanted to show using a daily chart but would be too wide for display. Forgive minor variances on fibs etc. as I have tried to show the big picture on a small chart. I tried to adjust the RSI to reflect true pic on this chart. I have serious problem with valuations vs REALITY.
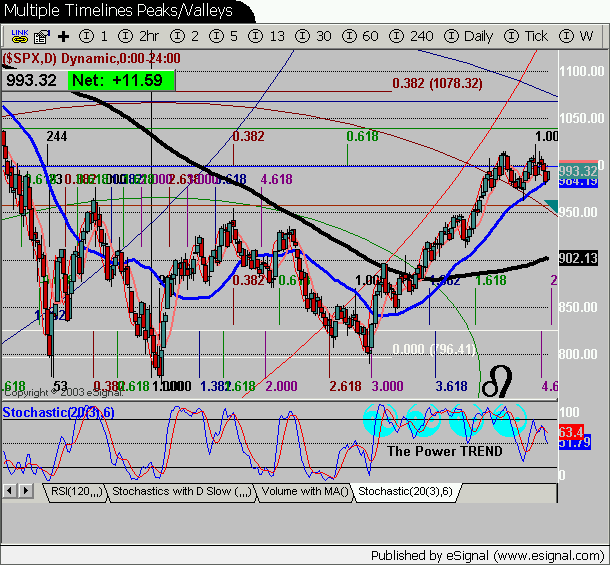
That is an excellent study. it's obviously a good stochastic histogram of something? Very close to a 10,3,2 which I recommend from experience. As your chart shows in pink the sideways move
shows the strength of the trend. Once the 20/80 are broke the trend is usually over. I also like the crossover signals a 10, 6, 8 gives particularly useful in color bar studies. There is nothing
wrong with lengthing the %k >10 many prefer a bit longer to smooth out. A 20, 6, 8 will give good picture running a daily chart live or just bump the %D up alittle 20, 3, 6........Just some ideas I will expand on with my own charts later.
I had seen some GET charts using multiple histograms well. I was intending to play around some myself when I get a script to play with.
Thanks for the charts and comments.
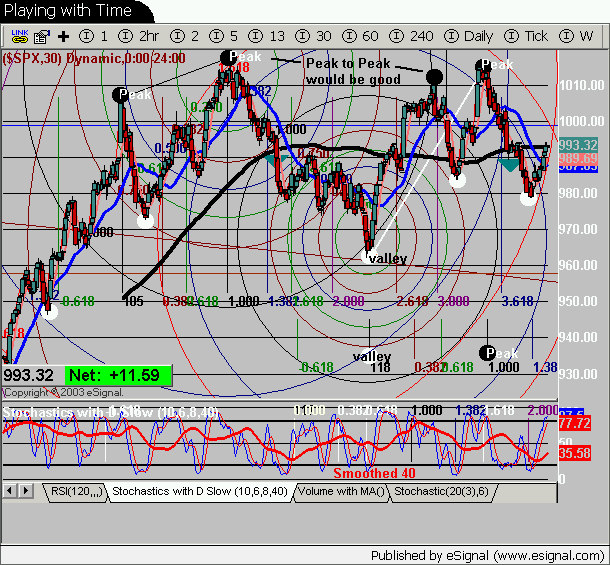
Oh yes, regarding timelines, can be useful from peak/peaks peak/valley, valley/valley, valley/peak etc. and crossovers even candle events!
Here is a small example with multple timelines. I usually look for major tops/bottoms in daily or weekly and then go down to whatever timeline I'm trading even a 2min chart....I will be discussing the uses of the 2min charts later. A 2min is simply a microcosm of this daily chart. If you can interpret the candle patterns and MA's on this chart. The beauty of 2min is the bigger MA's are more useful.
I don't believe any of this stuff is an actual science but mearly tools that suggest patterns that naturally occur. How you interpret what is happening is all relative and it's your attention that is the key component and what your thinking develops. IMO
Just playing here to demonstrate options on methods of use :Below
I normally use the 2min expanded much more than this.
Therefore this chart is alittle misleading because I'm trying to
convey ideas first in a compressed chart.
This tighter view is better for trading still constrained
view for demonstration.....a very bullish day.
See the 2min NDX chart for more realistic view of a trading chart. The trading "envelope"
I was little surprised this morning to see you so convinced to an uprise at the opening . As you know correlation bet Nazd & S&P - when it's happen - is Leaded by S&P and DJ
when I said High 1015 was because from that high on SQ of 9 I got some good Hints ( carefull I mean Hints not that I based my opertivity on that) like:
977 ( almost touch just at the level of a primary mob)
968-967
946
If you add the analisys On the long term with Fib Time and the yellow Gann Line starting from the winter low and the others Gann interesections , they gaved me a better widom of the fact that my Ellipse direction wasn't that wrong.......
P.S : now I'm long on the green swing designed by the Harmonic Number from the Top......
But EGADS, whatever happened to all the discussions we had on Phoenix' emini thread about keeping it simple, LOL!
I'm still using a mixture of candle charts with renko, but with an emphasis on renko.....mostly trading the YM these days as I find it charts better for my style of trading:
Nice to hear from you...nice renko chart...I know nothing about them....I see you made good money today! Maybe you can post a few more renko charts explaining the finer points how a professional makes it look easy.<g>
Originally posted by linus71 Fabrizio,
I think there's a little misunderstanding.
I wasn't convinced of an uprise. Looking at the daily charts which we posted, I'm rather waiting for a bearish reversal. Although there's also a chance for an upward move (especially within that Box Range) (and speaking in daily intervals).
So I was quite puzzled when you asked 1015 because we already had 1015 two times. Posting daily charts I didn't think in intraday terms.
Well yes, Gann, still haven't checked out his big big study.
I've tried the angles. They're looking nice but I don't know how to use them to make money - or - how to use them to make more money than I make now - or - I think other studies are more efficient yet easier to use (simply because I'm making money on these). So I'm not using Gann studies.
And as I can see for your short term plays you're not using Gann either. Or do you?
Linus
Got it.
No , In trading I make money with Elliot & Tom Demark
Though i enjoy "plaiyng " on the side of the forecast , with Geometry and experimenting others not contraddictory approach with Elliot and TDM ( even if more esotheric)
So, while I try to understand what "this market is telling me" after my regular Home work (AGET in the FULL EXTENT and intermarket analiysys) and TDM ( I cannot use it now cause I'm used to CQG full package and I'm strugglling to feed TS2K in order to have all my dearest TDM studies) , I put in action some non conventional analisys.
This is it. If they confirm my AGET strategies, I'm glad . If they not...... I keep on with my AGET even if........on the long term a DGL line can as a strong S or R can make me thing seriuosly about my decisions.
My trading activity is ruled however on TF of 45 Min 60 min, going lower to 13 in certain cases.
I appreciate this exchange of point of view, believe me.
sometimes I do risk -is true- some little money (just one contract) on some esotheric clues : like yesterday.....1.75 points Profit in contratrend long was worthwile to afford even if totally against my rules ( my stop was obviously very tight making an inacceptable 1:1 ratio in normal operations).
That was acceptable only because in a perspective of "understanding" and in a fearly profitable day.
I thought I was wrong and waited the market to shome the contrary: actually it did it and I was right. next time he'll probably confirm that I am wrong and give back to market those 1.75 points........on 1 contract .
 Tweet
Tweet


Comment