Announcement

Collapse
No announcement yet.

Which way will we go?

Collapse
X
 
  • Filter
  • Time
  • Show
Clear All
new posts

  • #16
    INTC EW Analysis

    Impulse patterns are not the most commonn Elliott structures. Corrective patterns are. Impulses are part of the corrective structure. Think in terms of Flats, Zig-Zags, Diagonals -- particularly because we are trading in the context of a correction off the 2000 highs.

    So, first, without going into a lot of detail. Start from the last major low.

    This is what you get: a Flat with a completed A Wave. B down is ongoing.

    Next, I'll take a closer look at that B Wave.
    Attached Files
    John Leabeater
    Editor/Publisher
    WallStreetBear.com
    [email protected]

    Comment


    • #17
      INTC B Wave - Y Closeup

      You could consider the Y Wave off the Double Zig-Zag complete. However, a closeup reveals it is not.

      Wave 3 of an inverted Impulse with a rating of 82.9 is most likely to complete before 18-Mar-2004.

      When complete, expect the overall slope (ie. price range divided by time taken) of this wave 3 to be between 47% to 194% of the slope of wave 1.

      Then expect the market to pull back into wave 4, which will be corrective in nature like a Flat or other sideways pattern. Wave 4 should not retrace back into the price range of wave 1 or 2.

      Expect wave 4 to have between 5% - 140% of the price range of wave 2. The expected time for wave 4 to complete is between 16% - 136% of wave 2. After wave 4, expect wave 5 to move beyond the end of wave 3 to complete this Impulse.
      Attached Files
      John Leabeater
      Editor/Publisher
      WallStreetBear.com
      [email protected]

      Comment


      • #18
        John --

        Those are some very interesting points! I obviously have NO CLUE about waves. Fabrizio can probably appreciate all this but I just look at INTC and see: Uh-oh -- our 50-day just crossed our 100-day, yikes! But, as long as we maintain 200-day, I'm not jumping out the window just yet.

        What books do you recommend (Fabrizio/John?) on reading about elliott waves? Just the original works?

        Linus --

        >> NQ will rally nowhere as long as volume leaders like INTC, SUNW, MSFT, ORCL, CSCO, or AMAT

        I agree. I do track every NQ stock > 1% of the index. With rare exception, they are all showing divergence on their lows or sitting in a nice base.

        While I would LIKE INTC and MSFT (especially) to cooperate and rally w/ QQQ -- I just need them to behave for a bit and sit still...

        We may not get a huge sustained rally but, we should get a nice boost for the next few days while we blow-off this divergence.

        After that -- we'll have to see what the market is showing!

        Which is why I think a break of the 200-period could be a beautiful thing...

        Comment


        • #19
          Originally posted by fabrizio
          Last bar on 30 min is downward "Price Flip "


          IMHO I guess it will....
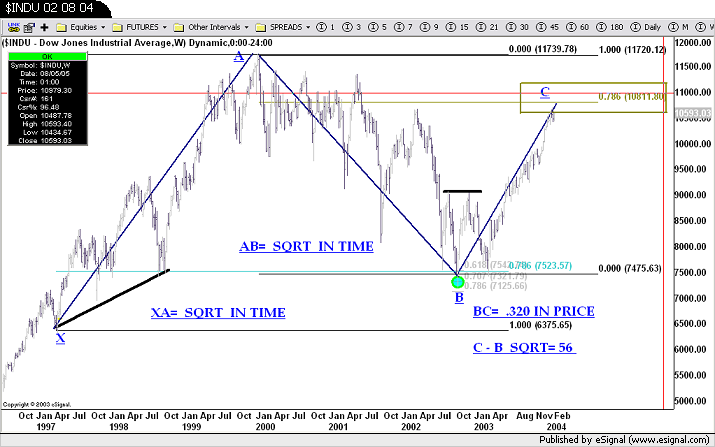
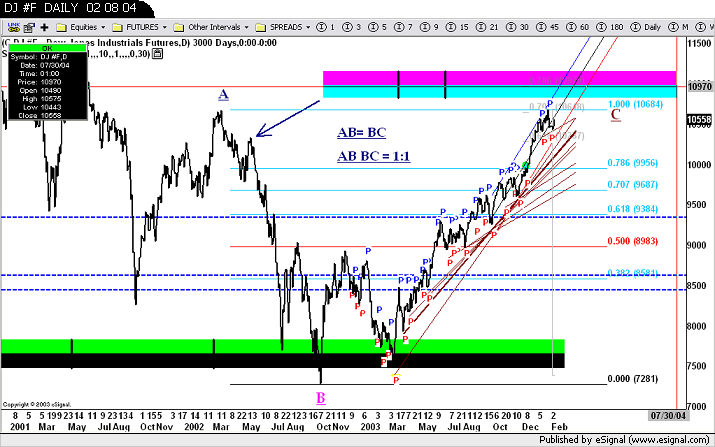
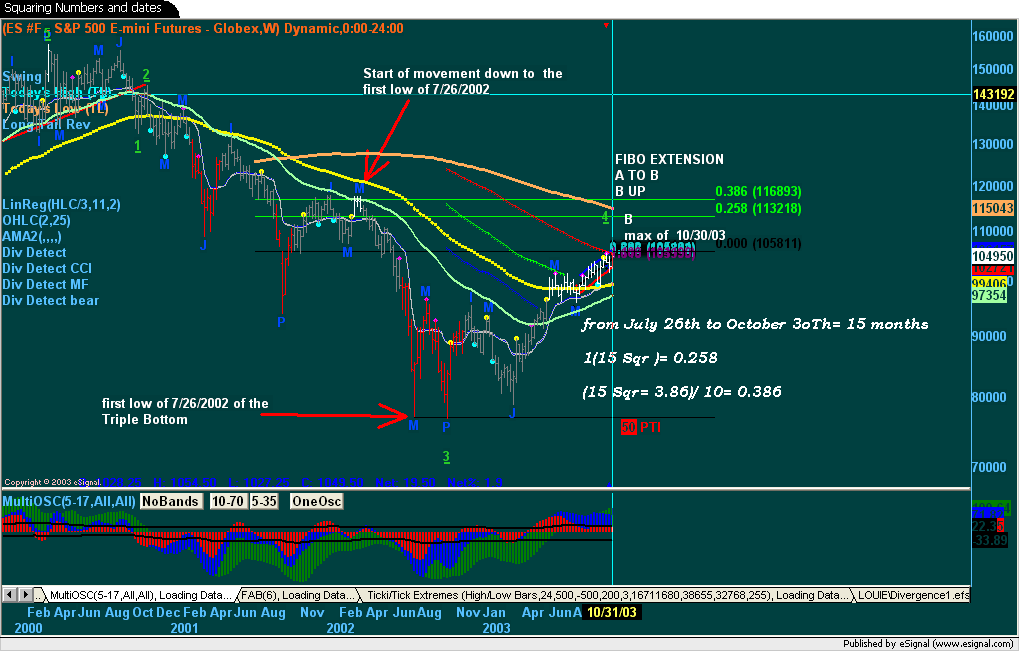
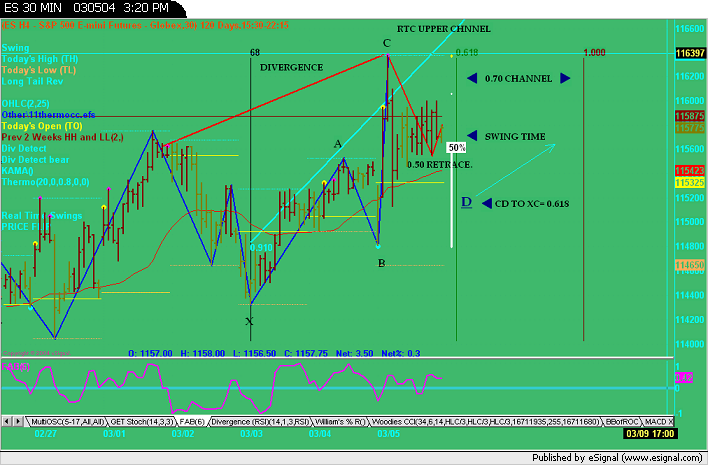
          On the Long term: The structure has not changed . Side by side S&P and INDU: please recall what noted in previous posts:


          Note: Charted October 31st 2003


          At the beginning of February I stressed that INDU has rallied with no stop since end november AND closing January with a positive growth . From 1962, 7 times out of 9 in such event brought INDU to a new max within 6 -9 weeks. This brings us to beginning , firts half of March. Furthermore "phiscally" I cannot expect that a "train "with such a strong momentum will exaust its upward inertia suddendly.
          The geometrical ratio of .786 with the prior absolute high is a strong ceiling in retracement and has been well respected; more - as you can see - it cause likely sideways; this big corrective movement from the first of the triple low has gone too far and the new down ward structure
          will be certainly a painfull one.
          I mean by this that in either case:
          - we are in a campaign W4 the following W5 will not be clean and neat.
          - we are in a C complex , went over 2.618 BA ; the next entire big structure will unfold not "neatly" ....bringing us toward year 2006


          In short term I meant that sideway wil be very likely the note for the next 3-5 days ;
          even if the D point will be reached the new X ABCD structure will bring it toward the prior top.... inside an "70% " Fibo Time channel upward

          Books? there are many . But what i can suggest you is having a on to one tutoring with a good teacher. It will cost you money , but you will learn a lot from his experience.
          My point of view is radically different from the fella Linus. Reading the original is a must. Since RN Elliot was definitively clear in his position and his respect for a natural order which rule everithing is to be fully understood by his own words. Linus know my adverse position towards Pretcher but -however- if you should start somewhere its a good start . All the "Father & Son" Fisher's books on Fibo are great education ( except the very last book almost -IMO- useless). Robert Miner , among the gretest in terms of Elliot analisys and Dynamic Trading is a MUST

          IMO you should have your education even in Gann Side , thought there is no apparent direct relation among the two.
          AMOF one of the strange points is that Gann- well aware of Elliot's studies and Fibo's relations among waves- never quote Fibonacci and the PHI; always mentioning his ratios in octaves.

          WD Gann is very much in swing chart.
          And you can bet that among one and another swing he knew the ratio, though never revealed. Since that ratio is part of law of nature , must be related even to the PHI and its reciprocals.

          In my very personal opinion you should browse leabeter site. You will understand a lot.
          Last edited by fabrizio; 03-06-2004, 08:34 AM.
          Fabrizio L. Jorio Fili

          Comment


          • #20
            Fabrizio L. Jorio Fili

            Comment


            • #21
              Attached Files
              Fabrizio L. Jorio Fili

              Comment


              • #22
                New to eSignal

                Originally posted by fabrizio
                What type of chart is this, Fabrizio?

                Comment


                • #23
                  Nuno

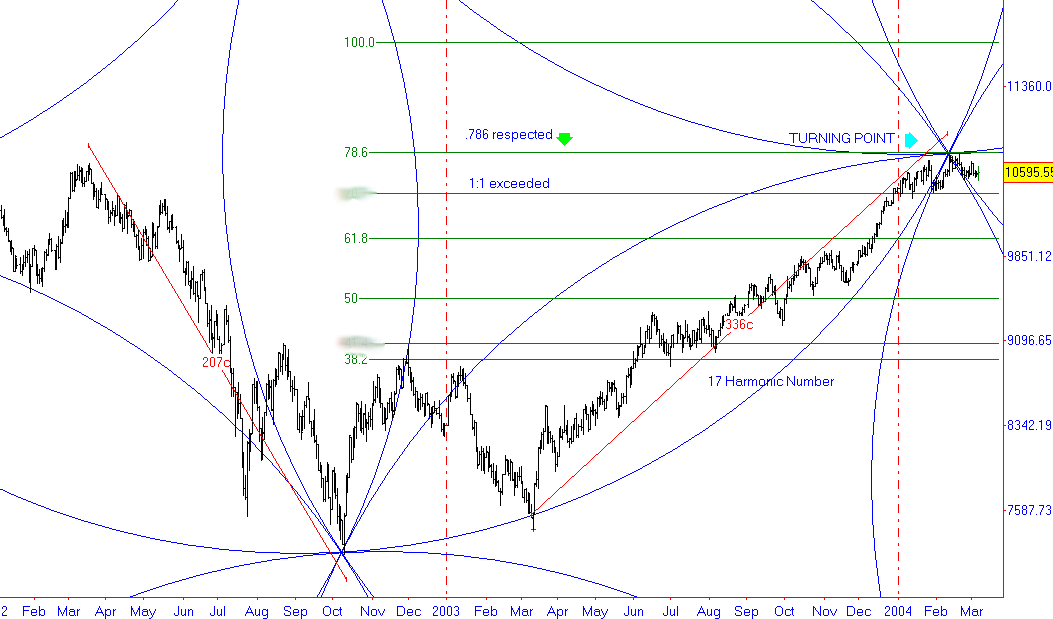
                  "Flower of Life". a tool based on Sacred Geometry;
                  The tool origin from the concepts expressed by Drunvalo Melchizedek in "The Ancient Secret of the Flower of Life, Volume 1".
                  Define Movements ellipses and S/R. Its calculation is based over the Radius of Circle.
                  Fabrizio L. Jorio Fili

                  Comment


                  • #24
                    Originally posted by soylent

                    Linus --

                    >> NQ will rally nowhere as long as volume leaders like INTC, SUNW, MSFT, ORCL, CSCO, or AMAT

                    I agree. I do track every NQ stock > 1% of the index. With rare exception, they are all showing divergence on their lows or sitting in a nice base.

                    While I would LIKE INTC and MSFT (especially) to cooperate and rally w/ QQQ -- I just need them to behave for a bit and sit still...

                    We may not get a huge sustained rally but, we should get a nice boost for the next few days while we blow-off this divergence.

                    After that -- we'll have to see what the market is showing!

                    Which is why I think a break of the 200-period could be a beautiful thing...
                    Well -- can I say -- I was wrong about the next direction? And, no need to worry about that 200-period average for a while!

                    And, dang, if INTC didn't just dump below the 200-day along w/ MSFT.

                    Painful. And, I want to know who tanked us @ noon! It's getting so you can't go to lunch w/o carrying a QUOTREK (anyone get one of those? Any good?).


                    -c

                    Comment


                    • #25
                      QQQ Direction / WAVES?

                      OK, for all the Elliott Wavers --

                      I'm still picking this up but please let me know what you think of my analysis for QQQ?

                      Thanks!
                      Attached Files

                      Comment


                      • #26
                        Elliott Waves have rules. However, the application of those rules is subjective.

                        That said, it appears to me that your 2 should be moved to March 2nd. If you take a look at a 30 minute and 60 minute chart the 3-3-5 pattern of a flat will be a bit more apparent. As for the upper target of the current subwave I come up with something near 35.75. For your 3 wave target consider that the main rule to remember about 3 waves is that they are never the shortest. They can be shorter than 1.618 of wave 1 or much longer.

                        Others surely have different interpretations. Only the passage of time will determine which one is correct.

                        Comment


                        • #27
                          Gavishti --

                          Thanks for the insight.

                          Even if my chart was right (probably not), if the target is 1.6 it equals about the same as a 1.0 if the March 2 wave 2 is used. And, doesn't much affect the fork...

                          Amazing. It's neat how these things can be 'proved' in so many different ways. I suppose the most convergences is the winner.

                          Just curious: If you look @ $compQ -- does it look like we may have completed this correction and are now actually ready to rally? (And, that would turn this whole mess into an A-B-C on QQQ or, I guess, just a 1-5 w/o divergence?)

                          Thanks,

                          -c

                          Comment


                          • #28
                            RE: $COMPQ

                            It looks to me like we are completing a minor C wave up. Target is 1996, possibly 2010. The completion of the C wave is probably the wave 2 of the larger 3 wave down that started March 5. First target for the larger 3 wave down is 1843. The target for the end of the fifth wave down is around 1700. That is also my target for the larger wave 1 down from the January 2004 high. The January high being the completion of an A-B-C from October 2002.

                            Tried to post a graphic, but my resolution is too high and I can't get anything down to a size that is within the limits and still have it large enough to read.

                            These are just my interpretations. I'm sure there are other opinions.

                            Comment


                            • #29
                              Wow!

                              Thanks for that.

                              I still can't figure out when to label something an 'abc' or 1-5.

                              It still bothers me that COMPQ isn't showing more weakness on the oscillator. But, it will be interesting to see how it progresses over the next few weeks!

                              Leabeater? Fabrizio? Any thoughts on all this? (Other than you told me so?? <smile>)

                              Comment


                              • #30
                                Monitor next week for sell opportunity.
                                Nothing fancy, just a good risk/reward
                                setup, trailing a tight stop for quick profit?
                                Marc

                                Comment

                                Working...
                                X