Announcement

Collapse
No announcement yet.

Determining the slope of a trendLine

Collapse
X
 
  • Filter
  • Time
  • Show
Clear All
new posts

  • #16
    Hi Jason:

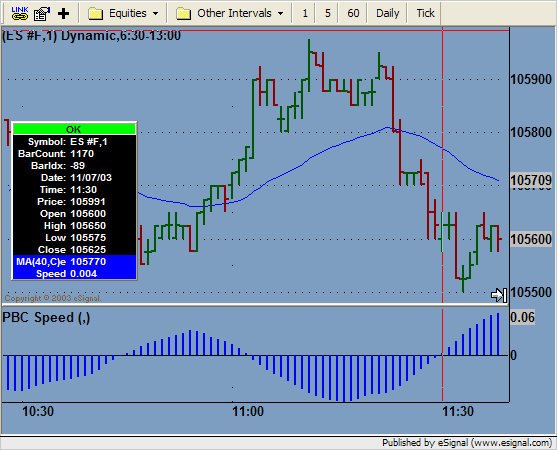
    By speed in the context of my previous posts with David, is the speed of rise or fall of an EMA over a certain period of bars or time units, expressed as units of EMA(rise or fall)over that time.

    In formula form it would be:

    (EMA2 at time T2 minus EMA1 at time T1) divided by (Time clock at time T2 minus time clock at time T1)

    The result would have units of EMA difference over time thus the concept of speed.

    If there is or if an EFS could be written to evaluate the following:

    Hour clock at time T2- Clock of time T1= Difference of hours and
    Minute clock at T2 - minute clock at T1= difference of minutes and
    seconds clock at T2 - seconds clock at T1= difference of seconds.

    The hours diference could then be multiplied by 60 to convert to minutes then added to the difference of minutes then added to the diference of seconds/60 to convert to minutes, and the sum in minutes divided into the difference of EMA at T2 and T1 resulting in an absolute number reflecting the rate of rise(+) or rate of fall(-) of the EMA whicj could be ploted in a non price study.

    Hope this explains what I am looking for but please let me know otherwise.

    Thanks for your help

    PBC
    Comment


    • #17
      Hi Jason:

      As a followup to my previous post, and for all intents and purposes, since the one minute slopes are of interest, you may disregard the hour and seconds time clocks calculations, and base the calculations on minutes difference only to simplify matters.

      Key point here is whether an EFS could be written to reflect the number of minutes between x numbe of bars on 1 minute charts.

      PBC

      Comment


      • #18
        This should work on any minute interval.

        Note also the Formula Output window shows the recent values of the ema change over the look back period desired.
        Attached Files

        Comment


        • #19
          Hello PBC,

          Is this close to what you had in mind for speed?


          PBC_speed.efs

          Jason K.
          Project Manager
          eSignal - an Interactive Data company

          EFS KnowledgeBase
          JavaScript for EFS Video Series
          EFS Beginner Tutorial Series
          EFS Glossary
          Custom EFS Development Policy

          New User Orientation

          Comment


          • #20
            To Jason and David--------BINGO!

            This is exactly what I was looking for with two different displays actually complementing each other to boot.

            David's portrays the polarity (+/-) if you will of the EMA, and Jason's the variations in "Speed". By Superimposing the two studies I was able to portray the two characteristics in a single panel.

            I have a couple of comments and sugestions:

            On Davids EFS, it takes about 4-6 seconds to load or modify after a change in parameter such as the Lookback parameter. I also noticed in the EFS the intoduction of the Debug function which I have never seen before in a EFS. Could that be creating the delay? and could it be removed to speed up the response?

            Jason's EFS is a piece of art I thought in its brevity and function. I interposed vEMA and vEMA1 in line 28 so as to have the histogram agree with the "Polarity"(+/-) of the EMA slope.

            One capability I really like doing with the Wizard in connection with MACD histograms, is a non price study panel that tracks the direction and polarity of the histogram namely:

            If histogram is Negative and climbing(i.e bar2>bar1) barcolor lime
            If Histogram is Positive and climbing (bar2>bar1) barcolor green
            If histogram is Positive and declining (bar2<bar1) barcolor orange
            If histogram is Negative and declining (bar2<bar1) barcolor red

            I wonder if this feature could be applied to EMA_Speed efs by coloring the histogram bars in accordance with the above color scheme. That would really make it a prime study comparable to any of the built in studies to be used for trading purposes.

            In fact I would like to suggest that we apply for a patent for that efs and Study in our three names, and market it in the investment litterature as a new Indicator and /or Oscillator equivalent to Stochastics, MACD, Momentum and the like.

            Any thoughts you and Esignal may have on the matter would be appreciated.

            In any case I really appreciate your and David's help in the development of this study.

            PBC

            Comment


            • #21
              I think my debug stuff is slowing the updates down, big time, just put a // in front of the debugprintln( and that will comment out the command.

              Jason is an artist, I agree 100%. probably more.

              I'll add my ideas on how to color the ema histogram in a sec. brb

              Comment


              • #22
                ema rising = green

                and I changed the direction of speed to be ema-ema1
                Attached Files

                Comment


                • #23
                  PBC
                  I think the attached version does what you asked
                  Alex

                  Attached Files

                  Comment


                  • #24
                    Thanks Alex. You may recall we had a good dialog developping and EFS for the ParabolicSAR with alerts a couple of weeks ago.

                    And now you come again to my rescue with the color modulation of the EMA "Speed". your latest input does exactly what I had in mind and thank you for your help.

                    As mentioned to Jason and David in my prior post, the EMS-Speed EFS is turning out to be a valuable indicator/oscillator comparable to Stochastics and MACD, and worthy of inclusion in the built in formulas and of patent protection.

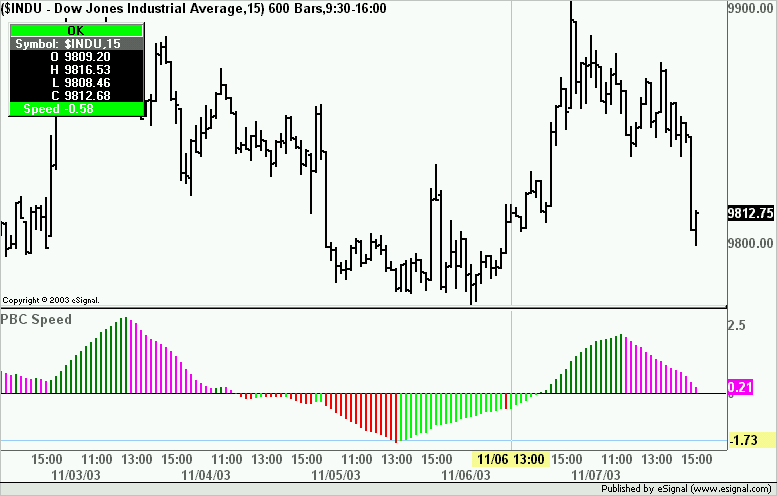
                    I am using it with a lookback period of 5, and the resulting histogram gives a vivid representation of the trend in any time frame. Just by looking at it you can tell the following:

                    Generally if the histogram is +ve your in an up trend and if -ve youre in a downtrend.

                    If the color is lime, you know you're in a pullback in a downtrend
                    since the histogram is in negative territoy but climbing;

                    Green you're in an uptrend

                    Magenta your in a pullback in an uptrend

                    and Red your in a down trend.

                    Finaly I notice the histogram further depicts a very powerful feature of detecting divergence with the chart. If a higher high in the chart results in a lower high in the speed histogram it portends an imminent reversal since the speed of the rise is not confirming the rise and vice versa..

                    Looking forward to your'all comments

                    PBC

                    PS: Could I possibly impose once more by asking you to include editable sound and triggered alerts at any change in color change?

                    Thanks

                    Comment


                    • #25
                      PBC
                      The attached revision will sound a ding at every change of color.
                      Alex
                      Attached Files

                      Comment


                      • #26
                        Thanks Alex

                        Sorry for the late acknowlegement, but for some reason my program quit notifying me on startup and or at preset intervals, of any new bulletin posts. Could you please suggest what to do to restore/reactivate this feature. Also confirming emails quit too.

                        With regards to Ema-Speed3, that helps, but since I am using this EFS in different time frames, could you please modify to include a triggered alert message with symbol time and interval stamp?

                        Thanks

                        PBC

                        Comment


                        • #27
                          PBC
                          The attached variation now includes Triggered Alerts that provide symbol and interval.
                          Alex
                          Attached Files

                          Comment


                          • #28
                            Alex

                            Is it possible to get values of histogram upto three decimal points


                            thanks
                            sukh

                            Comment


                            • #29
                              sukh
                              I do not believe it is possible to control the number of decimals of a plot.
                              Alex

                              Comment


                              • #30
                                Alex:

                                Thanks for EMA speed 4. It did exactly what I was looking for and was able to ad triggered messages along with alarms for the various times crossovers I have.

                                However, the alarms and messages are coming at every tick which is a bit of a nuisance.

                                I tried to "make all formulas compute on close" from the efs settings menu, but that switched off the alarms amd messages altogether for all alerts I have.

                                Is is possible to make speed 4 only to alert on close while leaving all other alarms alone? and can you explain why the setiing swich disables all alarms even after the close of a given time chart?

                                Thanks again

                                PBC

                                Comment

                                Working...
                                X