Hi Jason:
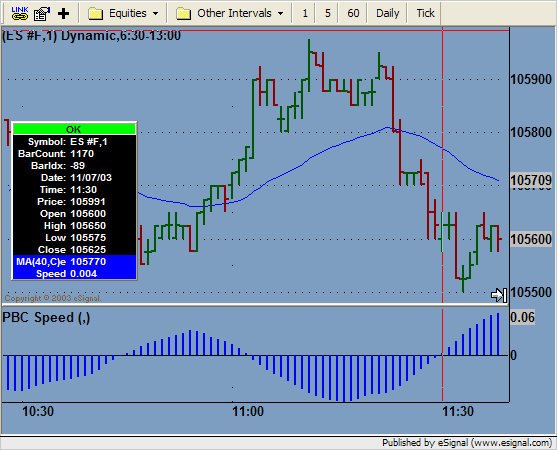
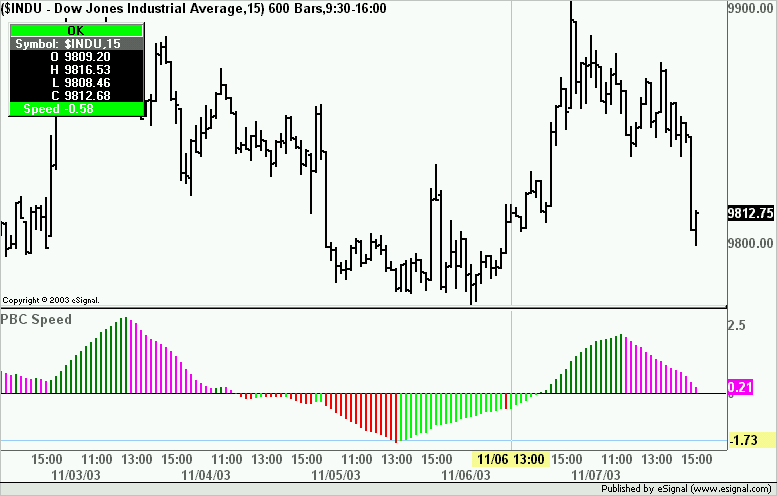
By speed in the context of my previous posts with David, is the speed of rise or fall of an EMA over a certain period of bars or time units, expressed as units of EMA(rise or fall)over that time.
In formula form it would be:
(EMA2 at time T2 minus EMA1 at time T1) divided by (Time clock at time T2 minus time clock at time T1)
The result would have units of EMA difference over time thus the concept of speed.
If there is or if an EFS could be written to evaluate the following:
Hour clock at time T2- Clock of time T1= Difference of hours and
Minute clock at T2 - minute clock at T1= difference of minutes and
seconds clock at T2 - seconds clock at T1= difference of seconds.
The hours diference could then be multiplied by 60 to convert to minutes then added to the difference of minutes then added to the diference of seconds/60 to convert to minutes, and the sum in minutes divided into the difference of EMA at T2 and T1 resulting in an absolute number reflecting the rate of rise(+) or rate of fall(-) of the EMA whicj could be ploted in a non price study.
Hope this explains what I am looking for but please let me know otherwise.
Thanks for your help
PBC


Comment