Announcement

Collapse
No announcement yet.

Bid_Ask Volume efs

Collapse
X
 
  • Filter
  • Time
  • Show
Clear All
new posts

  • #61
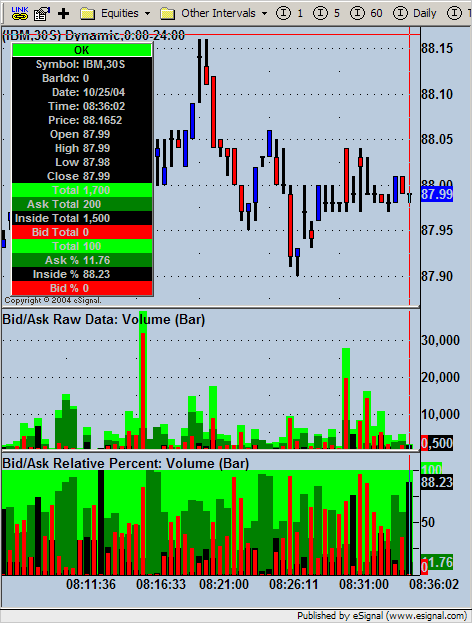
    Not a bad set of efs' to trade intraday with.
    Attached Files

    Comment


    • #62
      I'm a big believer in bid/ask and trade placement volume analysis, but I don't think just the inside bid/ask is enough. Market depth is what is really important, speaking only about index futures contracts traded on Globex or similar. Market depth is the bid/ask analysis more generalized.

      I've asked for Market Depth to be exposed to efs, but it's probably not going to happen, so I've written my own Java front-end to Interactive Brokers' Trader Workstation which graphically analyzes the full market depth for index futures contracts.

      What I'm saying is that the inside bid/ask is nice, but it doesn't tell you enough about where market players' intentions are. If price is going to rise, all of the ASK tiers will tend to inflate, and persistent size will be found at particular price regions. The inside ASK may actually shrink in that case, since why sell at the inside when price is going to rise, and you can sell higher? So they plant their offers higher up, knowing they will force price up to that level. Exceptions to this rule include "even number" levels, like factors of 10, 5, etc. These inflated sizes may often be ignored.

      The quote book is a secondary indicator anyway, and most of the predictive information comes in analyzing the tape's trend. This is simply an integration (average) of the bid/ask bias. *** If you're going to enhance this indicator, then *consider* adding a volume-weighted moving average of the volume of trades to the bid (+) vs trades to the ask (-) for each bar. Make the moving average period easily adjustable and scalable. That would be a useful further enhancement, if you don't have it already. That sort of tape analysis will give a *primary* leading indicator of price movement, imho. In the end, it's just old-fashioned tape reading (done with a computer), but when interpreted correctly, it's better than trying to find pivots from price action alone. Tape trending leads price trending, in general, in my experience. The market takes the path of least resistance, so when buyers are enthusiastic, they find their volume on rising price.

      I think it's great what you've done, and I've done this general type of analysis, as one of several key intraday trading indicators.

      What I would find very interesting is to look at the "firmness" of the bid and ask levels. What happens to the bid book sizes when retail sale trades occur to the bid? Does the bid stay firm, or does it retreat? Same for the ask price. When retail buyers buy the ask, does the ask stay firm, or does it retreat? This is difficult or impossible to do in efs, since you need a tick chart and the ability to distinguish trades from bid/ask updates. (another suggestion...)

      Anyway, consider this another request for market depth on Globex to be exposed to efs, because I believe there's a lot of information in the book which is yet to be extracted.

      Keep up the good work! Just my 2 cents.
      Last edited by bfry5282; 09-17-2004, 02:31 PM.

      Comment


      • #63
        Originally posted by bfry5282
        I'm a big believer in bid/ask and trade placement volume analysis, but I don't think just the inside bid/ask is enough. Market depth is what is really important, speaking only about index futures contracts traded on Globex or similar. Market depth is the bid/ask analysis more generalized.

        I've asked for Market Depth to be exposed to efs, but it's probably not going to happen, so I've written my own Java front-end to Interactive Brokers' Trader Workstation which graphically analyzes the full market depth for index futures contracts.

        What I'm saying is that the inside bid/ask is nice, but it doesn't tell you enough about where market players' intentions are. If price is going to rise, all of the ASK tiers will tend to inflate, and persistent size will be found at particular price regions. The inside ASK may actually shrink in that case, since why sell at the inside when price is going to rise, and you can sell higher? So they plant their offers higher up, knowing they will force price up to that level. Exceptions to this rule include "even number" levels, like factors of 10, 5, etc. These inflated sizes may often be ignored.

        The quote book is a secondary indicator anyway, and most of the predictive information comes in analyzing the tape's trend. This is simply an integration (average) of the bid/ask bias. *** If you're going to enhance this indicator, then *consider* adding a volume-weighted moving average of the volume of trades to the bid (+) vs trades to the ask (-) for each bar. Make the moving average period easily adjustable and scalable. That would be a useful further enhancement, if you don't have it already. That sort of tape analysis will give a *primary* leading indicator of price movement, imho. In the end, it's just old-fashioned tape reading (done with a computer), but when interpreted correctly, it's better than trying to find pivots from price action alone. Tape trending leads price trending, in general, in my experience. The market takes the path of least resistance, so when buyers are enthusiastic, they find their volume on rising price.

        I think it's great what you've done, and I've done this general type of analysis, as one of several key intraday trading indicators.

        What I would find very interesting is to look at the "firmness" of the bid and ask levels. What happens to the bid book sizes when retail sale trades occur to the bid? Does the bid stay firm, or does it retreat? Same for the ask price. When retail buyers buy the ask, does the ask stay firm, or does it retreat? This is difficult or impossible to do in efs, since you need a tick chart and the ability to distinguish trades from bid/ask updates. (another suggestion...)

        Anyway, consider this another request for market depth on Globex to be exposed to efs, because I believe there's a lot of information in the book which is yet to be extracted.

        Keep up the good work! Just my 2 cents.
        Everything you just said most hedge funds who have an emini guy have had tools like this for years now. I know , I use to be that guy and became disenchanted after finding out I was responsible for 75% of the profits but didn't get 75% of the bonus money, go figure. TradeMaven will be coming out with something like what you describe soon, along with a program trade detector. The easiest way to spot a program in action is to get realtime index quotes (by making your own index , getting all the individual stock quotes) and watching AD line and comparing it to the upticks/downticks of said index. An example of this is 14:29 EST when the move in ticks went from -400 to +600 (finally hitting +1000 a little later) and the AD line went with it at the same slope. This is what your missing, the trades are more important in my opinion. The aggresivness of traders can't be seen in market depth, I don't put orders on the book anymore b/c either I want the trade or I don't. So showing size to me means nothing, only the trades and where it happens. So when a program kicks in it doesn't sit at a price, it just executes. Emini traders and anyone on GLOBEX just hit it. Most size you see on GLOBEX is arbs, the hedging going on between the eminis and big contract is really out of control these days. But it's the trader in the pits who hits the trade and then has his buddy put a standing order in to hedge. This is how I started out and was sponsered to do this and learn how things work. Last Friday was a good example of size being overtaken by what seemed like no size on the book. The ramp into the close was more or less gunners gunning for stops (stop hunters is what they call them). The technique was scooping, after the initial thrust up for 1 hour the size came back on the ask side and bids were thin. This was baiting action, they would show little size, let price drop .25-.50 and scoop up the ask filling the spread but still showing only 300 to bid vs 1000-3000 ask on all price levels. They scooped maybe 5000 CARS before panic set in and the sellers capitulated, which shows in outside trades. They then reversed and went long to make up for the loses, who was selling then? Me and the other scoopers. It isn't depth that influences price movement but the aggressivness of the traders, which can only be read by either watching the DOME or in bid/ask volume analysis. To tell you the truth, I haven't really dug into Esignals bid/ask quotes other than the studies on my chart. I more or less stare at the DOME and look for cyclical turns. When I'm not in a trade I will find direction for the day by confirming the price action studies on the chart with models, so the quality of the data doesn't mean a whole lot to me. Anyways, everyone has their own opinion and it's good to learn from others, thanks for sharing yours.

        Comment


        • #64
          Trade volume filtering

          Another suggestion I find useful. It's an "Us" vs "Them" analysis, by enabling filtering for block trades.

          Add a couple of parameters to the main(...)

          minTradeVolume
          maxTradeVolume

          If they're null, then just take all volumes.

          If minTradeVolume has a value, and maxTradeVolume is null, then consider only trades greater than minTradeVolume.

          If maxTradeVolume has a value, and minTradeVolume is null, then consider trades if smaller than maxTradeVolume.

          If both have a value, ensure min < max and consider trades only in that volume region ( min <= ticVolume <= max)

          Problem with this is that when you change the parameters to efs, you have to reload the study and you lose all intra-bar analysis. So, I work around this by using control buttons, or isn't there a pop-up dialog from efs which would be used to enter alternate values without resetting the efs study? (seems like there was something like that).

          Of course, you can have a "floating" set of thresholds for min and max volume, because the market is dynamic. But a given issue (futures anyway) has a particular personality, and values can be selected which make sense.

          Anyway, volume filtering is often important. When the block trades come in, the big boys are scooping up volume, in preparation for pivot generally speaking. (as always, with the market, there are exceptions)

          Comment


          • #65
            Hello bfry,

            I think the function you are referring to is the askForInput() function, which is just a shortcut to the Edit Studies dialog. It still resets the EFS after making changes to the formula parameters. Anytime an EFS's formula parameters are changed through Edit Studies, the only way for the EFS to take the new parameters into action is by destructing and then reloading the EFS.
            Jason K.
            Project Manager
            eSignal - an Interactive Data company

            EFS KnowledgeBase
            JavaScript for EFS Video Series
            EFS Beginner Tutorial Series
            EFS Glossary
            Custom EFS Development Policy

            New User Orientation

            Comment


            • #66
              Dang... wish you could build in a "don't reload me" call to the preMain of selected studies.

              Anyway, the only ways I know of to enter or control internal parameters is to use buttons, or to read data periodically from a file, thus defeating the reload.

              Anyway, I've actually gone to the trouble of building a "control panel" for an efs study, which uses setGlobalValue(...) global variables. These, in turn, are picked up by the efs and bypass the main(...) arguments. The control panel study itself does reset, but "runs once", setting global variables, and the main efs which uses the parameters does not have to reset...

              Most of this would be less of an issue if reload would reload the local tick data, rather than end of bar. But sometimes you don't want any reload at all.

              Anyway, bottom line is that if you are doing intrabar tick analysis, you have to jump through hoops, because eSignal is primarily "bar-oriented".

              Consider this another request to have a non-reloadable edit studies main arguments change.

              function preMain() {
              setNoReloadOnEditStudies();
              }

              Obviously, as the efs writer, I have to ensure that things work smoothly and do not rely on the "Big Bang" of formula reload.

              Can we have this for the next release? Only joking...

              TIA
              Last edited by bfry5282; 09-17-2004, 05:29 PM.

              Comment


              • #67
                Example of Bid/Ask Price/Volume analysis

                Here's a charting example of what I was discussing in a previous post. Block volumes are important, Bid/Ask analysis, and a moving window of market inventory, whether long or short against the retail trading public, work together to identify significant pivots.

                This does not show Market Depth Book analysis, which is more of a secondary indicator anyway. The tape, and market inventory, plus block volume placements are the primary trading indicators.

                This information is used for scalping, where $100/contract is the unit point value for ER2Z4 (eMini Russell 2000), and 0.1 is the minimum tick size ($10/c).
                Attached Files

                Comment


                • #68
                  Re: Example of Bid/Ask Price/Volume analysis

                  Originally posted by bfry5282
                  Here's a charting example of what I was discussing in a previous post. Block volumes are important, Bid/Ask analysis, and a moving window of market inventory, whether long or short against the retail trading public, work together to identify significant pivots.

                  This does not show Market Depth Book analysis, which is more of a secondary indicator anyway. The tape, and market inventory, plus block volume placements are the primary trading indicators.

                  This information is used for scalping, where $100/contract is the unit point value for ER2Z4 (eMini Russell 2000), and 0.1 is the minimum tick size ($10/c).

                  You'd be able to market to a huge number of people IF you used ES instead. Then you might find block trades a little diceptive, I know when I hit the spread with 50 I see alot of 1's and 5's running by on the T&S. In the case of ES I still think it's all about where the trade happens, along with a little talked about subject of trade velocity. Trade velocity is huge when marking turning points, as well as bid/ask volatility at turns.

                  Comment


                  • #69
                    Plumber,

                    Is trade velocity same as trades per second or something else?

                    Trading is all about volume, and where the market can find volume, as well as absorbing price adversity up to a certain point, before the market "wants" to turn.

                    Anyway, what's so great about ES? It is going to depend upon trading style but, for scalping I like ER2. Recommending ES is like recommending INTC in stocks. Whether it's a good instrument depends largely upon trading style.

                    For scalping, ES has many disadvantages. Personally I prefer ER2 as a good compromise between ES (too crowded) and, say, YM (not enough profit potential). There may be others which are not too heavily crowded and yet liquid, and show a good range. Any other ideas?

                    Anyway, the same principles apply, no matter which index futures contract you choose.

                    Just remember that to make 1 tick, price must move 2 ticks. Rarely can a small trader truly get wholesale fills.

                    Comment


                    • #70
                      Originally posted by bfry5282
                      Plumber,

                      Is trade velocity same as trades per second or something else?

                      Trading is all about volume, and where the market can find volume, as well as absorbing price adversity up to a certain point, before the market "wants" to turn.

                      Anyway, what's so great about ES? It is going to depend upon trading style but, for scalping I like ER2. Recommending ES is like recommending INTC in stocks. Whether it's a good instrument depends largely upon trading style.

                      For scalping, ES has many disadvantages. Personally I prefer ER2 as a good compromise between ES (too crowded) and, say, YM (not enough profit potential). There may be others which are not too heavily crowded and yet liquid, and show a good range. Any other ideas?

                      Anyway, the same principles apply, no matter which index futures contract you choose.

                      Just remember that to make 1 tick, price must move 2 ticks. Rarely can a small trader truly get wholesale fills.

                      Yes, trade velocity will not be as high @ turns vs the trend. This is one of the tools I've used. Another is the screenshot below that show volatility of the bid/ask oscilations, just another tool to find turns. What is so special about ES vs others? The ability to use size. Disadvantages? All the above you've listed, it's not for everyone and finding your style is of the utmost importance. The so called crowding, any pit trader will tell you that if you want the trade then hit the bid or ask, so crowding isn't an issue. Of course discipline of stops and and just being a good trader spotting the turns is a huge issue, as well as money management to exit the trade. I recommend ES to people who are experienced traders and can use size, institutions use INTC for this reason. Would I recommend INTC to a day trader? only if he/she can use size. I posted this chart in the geometry thread Fed day last month this is what I mean using size. Just mathematically speaking, 1 contract moves 1 point is $50. Multiply this by 1000 for an average of 2.5 points and you get ONE of my trades that day. I'm not bragging about money, in fact I had an average week last week (b/c of Monday and Tuesday) so what comes around goes around. Again, it's all about whether the trader can use size, and marketing to ES you will get a larger base of size traders, at which most strategies don't work as well as they do on smaller size traded instruments.
                      Attached Files

                      Comment


                      • #71
                        Well, I don't think you should ever initiate a market trade at the prevailing bid or ask. This is usually a bad price for both buyers and sellers. What you should do is to set limit orders slightly outside the market, and these will be hit (again, you will be paying retail, most of the time). I never use a market order, but let's say you hit the ask with a limit buy order. That's still accepting the prevailing ask and, if it's during a market pause, it will not be an advantageous price in general.

                        What I call "parked" or paused prices are generally not to be taken. "Parking" is when the market pauses, and everyone's wondering what will happen next. If, at that time, you either buy or sell, you're worse off than if you anticipated a buy/sell point when the market is in motion. The best prices occur only momentarily when the market is in motion, and the limit order gives you the possibility of catching those momentary fluctuations in the bid/ask on the exchange itself.

                        What I try to keep in mind is that the market is taking the opposite side of *every* retail trade, *both* buyers and sellers. So, near breakdown levels, both "bottom fishers" (buyers) and breakdown sellers are executing trades. The smart money in the market is trying to defeat both of these groups.

                        I'm not sure what you mean by whether you can use "size" or not. Isn't it just a matter of whether there's market liquidity, so that momentary fluctuations of bid/ask will bring the ask down to your limit buy order, or bring the bid up to your limit sell order? That's the reason to bid/ask frequently, even though you are more or less consigned to retail, rather than wholesale prices most of the time.

                        I'm still unclear what you mean by "trade velocity". Contracts per second spike to peaks at pivots, or just ahead of pivot development. What is your definition of trade velocity, because it could be the same concept as my "firmness" of the bid or the ask. During the midpoint of an uptrend, buyers hit the ask and the ask quickly rises, so that smart money can sell at the highest aggregate price, and continue the rally which stimulates volume.

                        After all, smart money always "makes the spread". Whether or not there is price movement, volume guarantees that they make money because they are "hogging" or "crowding" both the bid and the ask, several tiers out. Their deep pockets make it possible for them to absorb price adversity, and move price against their own positions (temporarily) in order to get volume and to develop average positions against the retail players.

                        Oh, well, there's lots of interesting topics in trading!
                        Last edited by bfry5282; 09-19-2004, 06:14 PM.

                        Comment


                        • #72
                          Plumber
                          your last post, you had two charts of volatility of the bid/ask oscilations. Is this something you came up with or is it a piece of software? I am always trying new things to find turning points and I would like to check them out.
                          Thanks
                          Mark

                          Comment


                          • #73
                            Originally posted by its1111
                            Plumber
                            your last post, you had two charts of volatility of the bid/ask oscilations. Is this something you came up with or is it a piece of software? I am always trying new things to find turning points and I would like to check them out.
                            Thanks
                            Mark
                            It's something that was given to me and don't really know what it is or isn't. It's a standing exe. but uses Esignal data. Just some of the tools I've come across. The bid/ask efs seem to work best with 2000V charts, at least this is my opinion. Price is moved to facilitate volume so it stands to reason why I think this works better than tick charts. Of course people can argue until the next decade on the internet about this so I'll just say it's just my opinion only and leave it as such. Some observations on todays trade of ES.
                            Attached Files

                            Comment


                            • #74
                              Hello All,

                              I'm long overdue for some code here. I finally have something for you to play with. This new formula, BidAskAnalysis.efs is set up to allow you to configure multiple types of Bid/Ask analysis. It's a non-price histogram study that allows you to choose the type of analysis (Bar or Cumulative), the type of output (Relative Percent or Raw Data) and the source (Ticks or Volume). You can change the colors and thickness of each output and may also turn off the display of any or all of the four outputs, which are totals for Bid, Ask, Inside and Total. With these options there are many possible configurations. Here are a few examples.

                              The study has been applied twice in the image below. The top study is the Raw Data for Volume on a Bar only analysis. The bottom study is the Relative Percentages for Volume on a Bar only analysis.


                              The image below are the same studies but they are analyzing tick data.


                              The image below configures the study to show Plumber's Bid volume vs. Total volume on a 2000V chart of ES.

                              Jason K.
                              Project Manager
                              eSignal - an Interactive Data company

                              EFS KnowledgeBase
                              JavaScript for EFS Video Series
                              EFS Beginner Tutorial Series
                              EFS Glossary
                              Custom EFS Development Policy

                              New User Orientation

                              Comment


                              • #75
                                Jason,

                                would like to know if there is volume diff efs available (did a search and came up with nothing) like the one Plumber has on his chart below.

                                Peter

                                Comment

                                Working...
                                X