Hi Jay,
Great! Many thanks for doing the MA.
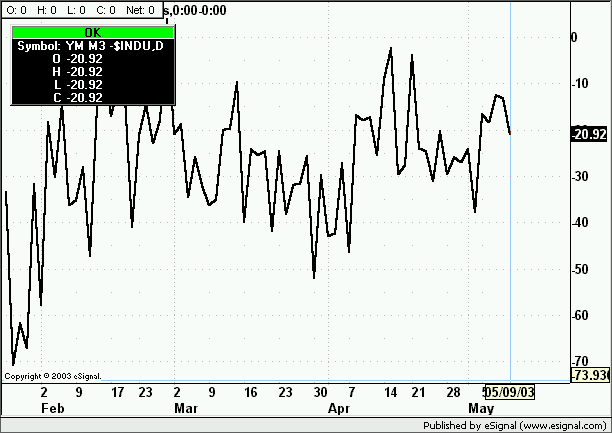
Couple of things - I've plotted the new indicator in a 1 min YM chart and refreshed the data but historically (yesterday for example) it still shows a premium where none occured.
You say not to use it on Tick charts but, TBH, it only really works on Tick charts... If I could plot the indicator and see it against the Ticks historically, that would be brilliant!
Also, changing the MA (in Tick charts) changes the indicator display somehow. Not a major problem as when the new ticks arrive in RT everything goes back to nromal. Some clever coding in that thar indicator!
Thanks.
Ian
Great! Many thanks for doing the MA.
Couple of things - I've plotted the new indicator in a 1 min YM chart and refreshed the data but historically (yesterday for example) it still shows a premium where none occured.
You say not to use it on Tick charts but, TBH, it only really works on Tick charts...
 If I could plot the indicator and see it against the Ticks historically, that would be brilliant!
Also, changing the MA (in Tick charts) changes the indicator display somehow. Not a major problem as when the new ticks arrive in RT everything goes back to nromal. Some clever coding in that thar indicator!

Thanks.
Ian

Comment