Announcement

Collapse
No announcement yet.

Two Symbols

Collapse
This topic is closed.
X
X
 
  • Filter
  • Time
  • Show
Clear All
new posts

  • #46
    I'm obviously doing something wrong.

    I've tried every variation of YM M3 -$INDU,D in all charts and quote windows, tried different Layouts, closed eSignal and restarted it and I still get the same error message.

    Ian
    Comment


    • #47
      Nice call Jay.
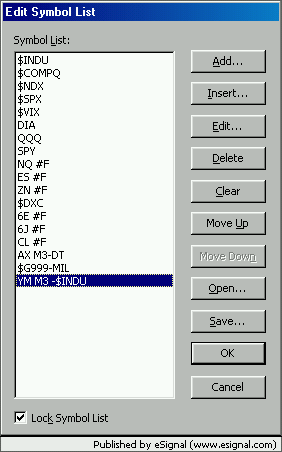
      Now here is an interesting thing. If you right click the dropdown symbol list, select Edit Symbol List then when the dialog box appears click Add... and type the spread, then hit Enter, then OK again - you can then call the spread as a symbol from the dropdown list.
      Alex

      Last edited by ACM; 05-09-2003, 03:33 PM.

      Comment


      • #48
        Argh!!!!!!!!

        YOU'RE A GENIUS, JAY!!!!!

        Brilliant! Brilliant! Brilliant!

        This is exactly what I was after (although no doubt I'll be back with more Qs next week!)

        Many, many thanks.

        Ian

        Originally posted by JayF
        At first I was stumped, and then looked at your screenshot again. Instead of typing the symbol into the box in the upper left, please click on the chart you want the symbol to "go into", and then start typing YM M3 -$INDU

        Voila!

        Comment


        • #49
          Certainly an interesting work-around Alex. I'm curious as to why this works, but straight typing the spread in doesn't. I'll have to bug the programmers about that one.

          Ian, great to hear this worked out for you.
          Regards,
          Jay F.
          Product Manager
          _____________________________________
          Have a suggestion to improve our products?
          Click Support --> Request a Feature in eSignal 11

          Comment


          • #50
            More good stuff, Alex. Done that now.

            Alas I'll have to wait until the markets open next week to try it all out.

            Thanks erveryone, have a good weekend.

            Ian

            PS: Is it possible to get word wrap in this Forum? I have to Maximise the window or scroll right to read all the posts? Ta!

            Comment


            • #51
              Hi Guys,
              The YM-$INDU is working fine, thanks.

              I have it set to 1 min. It doesn't work at all with any kind of Tick chart and causes eSignal to crash if you try. Don't know if that's useful/helpful.

              Can I ask if it's possible to write an indicator for this chart that will display the highest and lowest value during the selected period?

              Thanks.

              Ian

              Comment


              • #52
                Tick Charts on spreads are also locking my eSignal up. I'll have that investigated further by our QA Team and developers.

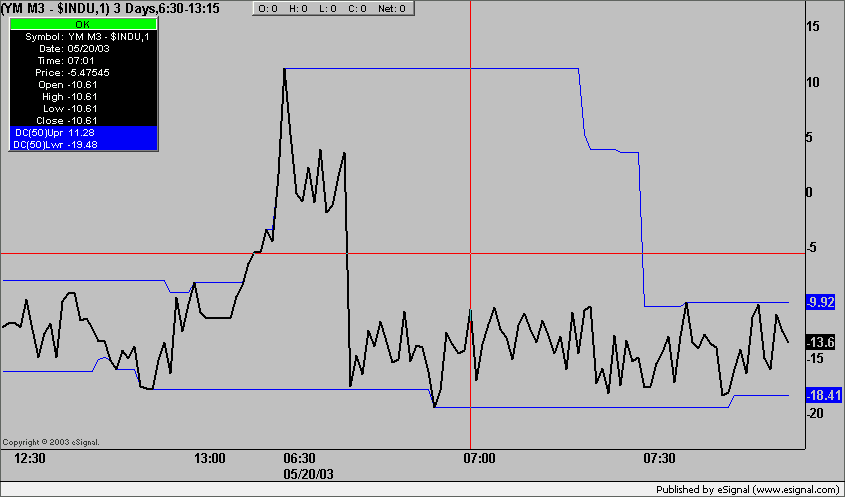
                Highest High and Lowest Low in a set period can be done through a Donchian Channel, which is one of the Basic Studies in eSignal. Please see below for an example.

                Regards,
                Jay F.
                Product Manager
                _____________________________________
                Have a suggestion to improve our products?
                Click Support --> Request a Feature in eSignal 11

                Comment


                • #53
                  Hi Jay,
                  I knew I should have explained that better...

                  What I meant was, is it possible to create an indicator that will plot the highest and lowest values (of the spread) during a 1 minute bar? As it is, the chart only plots the closing value. During the minute it can be much higher or lower.

                  Thanks.

                  Ian

                  Comment


                  • #54
                    Ian
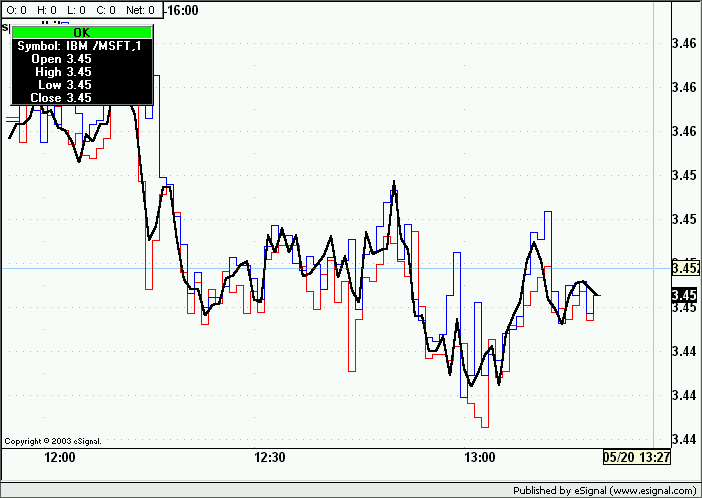
                    The attached efs is probably not the most efficient way to do this but it plots the spreads on the highs and lows of IBM /MSFT (see chart).
                    If you wanted you could now add the options to have an input in Edit Studies that allows to change the symbols
                    Alex

                    Attached Files

                    Comment


                    • #55
                      Hi Alex,
                      That chart looks exactly like what I had in mind!

                      I changed the symbols to "YM M3" and $"INDU" in the study and applied it to the "YM M3 -$INDU" 1 min chart.

                      First of all I get the infamous "Loading data" message (Time Template set to 2 days). I quit eSignal then load it again and the indicator plots so that's good but it just plots a straight line at 0.99.

                      Any ideas?

                      Ian

                      Comment


                      • #56
                        Ian
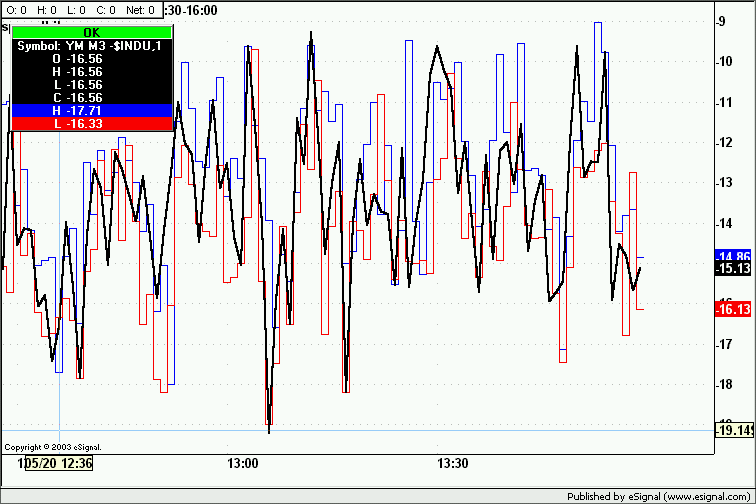
                        Here is a better version of the prior efs.
                        This one has YM M3 as sym1 and $INDU as sym2.
                        Also it allows to change the symbols through Edit Studies (and shows the defaults).
                        Lastly it actually is a spread whereas the earlier one was a ratio.


                        As to the issue you are seeing is the Time Template set to 9:30-16:00 (or equivalent if in different time zone)?
                        A more probable reason though was that you were plotting a spread while the efs was calculating a ratio and the values are very different.
                        Alex
                        Attached Files
                        Last edited by ACM; 05-20-2003, 12:10 PM.

                        Comment


                        • #57
                          Hi,
                          Can 7.4 handle a single chart with two different tick symbols?

                          Ian

                          Comment


                          • #58
                            Unfortunately, no this doesn't work effectively yet on tick charts.
                            Regards,
                            Jay F.
                            Product Manager
                            _____________________________________
                            Have a suggestion to improve our products?
                            Click Support --> Request a Feature in eSignal 11

                            Comment


                            • #59
                              Ah... What release might we expect this in?

                              Ian

                              Originally posted by JayF
                              Unfortunately, no this doesn't work effectively yet on tick charts.

                              Comment


                              • #60
                                No one...?

                                Ian


                                Originally posted by iantrader
                                Ah... What release might we expect this in?

                                Ian

                                Comment

                                Working...
                                X