 Tweet
Tweet
Just installed the latest download of v10...
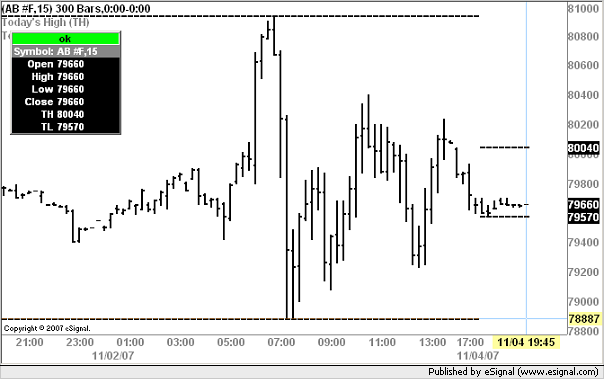
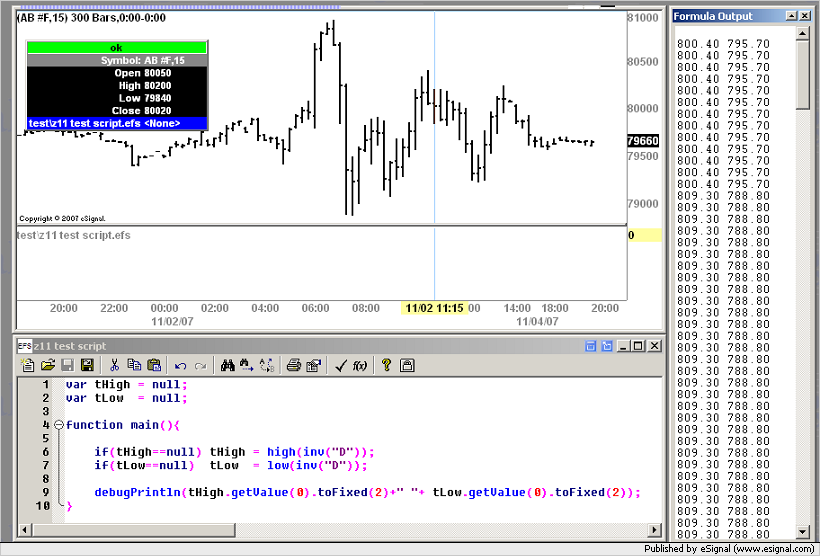
It is now 8:10 pm EST on Sunday, Nov. 4.
In EFS, e.g. for symbol AB #F, high(0,inv"D") returns the high of Friday Nov.2, same as low(0,inv"D"), 809.30, 788.80 respectively.
It should have returned 800.40 and 795.70 for the current trading day.
This problem exists for ES, NQ, YM as well.
Pls advise, eSignal folks.
Thanks.
Comment