Announcement

Collapse
No announcement yet.

Another Bug in ver10 build 859

Collapse
This topic is closed.
X
X
 
  • Filter
  • Time
  • Show
Clear All
new posts

  • Another Bug in ver10 build 859

    Just installed the latest download of v10...

    It is now 8:10 pm EST on Sunday, Nov. 4.

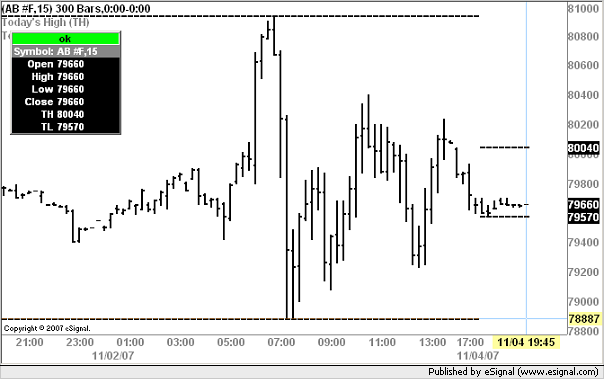
    In EFS, e.g. for symbol AB #F, high(0,inv"D") returns the high of Friday Nov.2, same as low(0,inv"D"), 809.30, 788.80 respectively.

    It should have returned 800.40 and 795.70 for the current trading day.

    This problem exists for ES, NQ, YM as well.

    Pls advise, eSignal folks.

    Thanks.
  • #2
    ziggy
    Please post a screenshot of your daily chart for any one of those symbols that is returning the High of Friday
    Alex


    Originally posted by z11
    Just installed the latest download of v10...

    It is now 8:10 pm EST on Sunday, Nov. 4.

    In EFS, e.g. for symbol AB #F, high(0,inv"D") returns the high of Friday Nov.2, same as low(0,inv"D"), 809.30, 788.80 respectively.

    It should have returned 800.40 and 795.70 for the current trading day.

    This problem exists for ES, NQ, YM as well.

    Pls advise, eSignal folks.

    Thanks.
    Comment


    • #3
      Humm, "daily chart"?

      The efs in question is run from a non-Daily Chart...such as a 1minute and 5 minute chart...

      Screen shot of "Formula Output" window showing the debugprintln statements?

      Sorry did not quite understand what you were asking for.

      ziggy

      P.S.

      to be clear, in the Daily Chart, the correct values are shown in the latest Bar for today's session. It is just in EFS that is returning wrong value.
      Last edited by z11; 11-04-2007, 06:40 PM.

      Comment


      • #4
        ziggy
        When you are calling another interval using the inv() or sym() functions you are essentially creating a chart in the background for that interval or symbol/interval.
        Because you are calling the daily interval I asked you to post a chart of that interval so as to see what the efs is referencing
        Alex


        Originally posted by z11
        Humm, "daily chart"?

        The efs in question is run from a non-Daily Chart...such as a 1minute and 5 minute chart...

        Screen shot of "Formula Output" window showing the debugprintln statements?

        Sorry did not quite understand what you were asking for.

        ziggy

        Comment


        • #5
          Re: Another Bug in ver10 build 859

          ziggy
          In looking closer at the calls you are using I notice that the syntax in both high(0,inv"D") and low(0,inv"D") is incorrect and should be high(0,inv("D")) and low(0,inv("D")) respectively
          Enclosed below is what I am seeing when running Todays High.efs and Todays Low.efs from ther OHLC folder
          Alex


          Originally posted by z11
          Just installed the latest download of v10...

          It is now 8:10 pm EST on Sunday, Nov. 4.

          In EFS, e.g. for symbol AB #F, high(0,inv"D") returns the high of Friday Nov.2, same as low(0,inv"D"), 809.30, 788.80 respectively.

          It should have returned 800.40 and 795.70 for the current trading day.

          This problem exists for ES, NQ, YM as well.

          Pls advise, eSignal folks.

          Thanks.

          Comment


          • #6
            I beg your pardon, that was strictly a typo in my post:
            actual efs statements (fragments):
            PHP Code:

            //global variables
            var tHigh null;
            var 
            tLow  null;
            ...
            //in main():

            tHigh high(inv("D"));
            tLow  low(inv("D"));

            debugPrintln(tHigh.getValue(0).toFixed(2)+" "tLow.getValue(0).toFixed(2)); 
            the debug printout has values:

            809.30 788.80


            Thanks for taking a look...

            ziggy

            Comment


            • #7
              ziggy
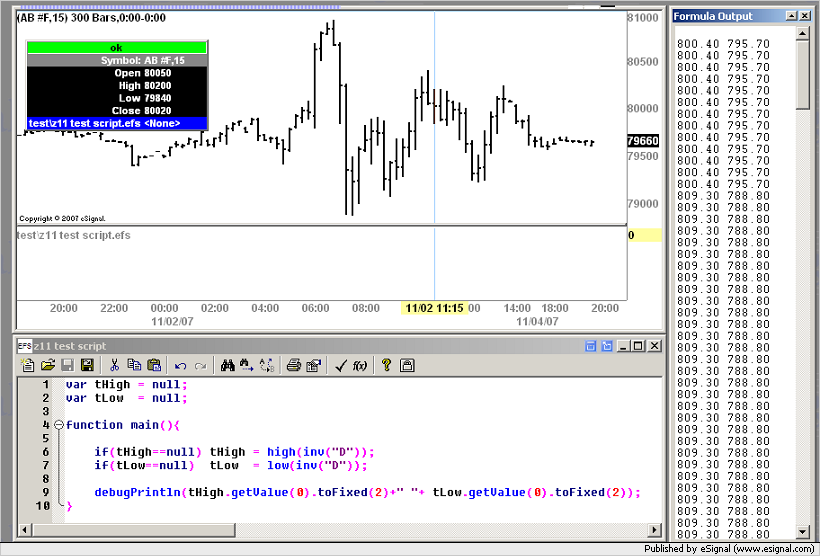
              Here is what I am getting in the Formula Output Window when running a script based on your sample code
              Alex

              Comment


              • #8
                this is what I got:
                efs run from 1 minute chart with Dynamic template.
                Attached Files
                Last edited by z11; 11-04-2007, 07:20 PM.

                Comment


                • #9
                  ziggy
                  At this point without having any details and the same code you are using I am unable to determine what could be causing the problem you are seeing and to offer any suggestions on how to resolve it.
                  Alex


                  Originally posted by z11
                  this is what I got:

                  Comment


                  • #10
                    This is the EFS that produces the problem I am describing:
                    PHP Code:
                    var sTitle="HiLo";
                    var 
                    bInit false;
                    var 
                    tHigh null;
                    var 
                    tLow  null;

                    function 
                    preMain() {

                        
                    setPriceStudy(true);
                        
                    setStudyTitle(sTitle);
                        
                    setCursorLabelName("todayHi"0);
                        
                    setCursorLabelName("todayLo"1);

                        
                    setPlotType(PLOTTYPE_FLATLINES,0)
                        
                    setDefaultBarFgColor(Color.green0);
                        
                    setDefaultBarThickness(20);

                        
                    setPlotType(PLOTTYPE_FLATLINES,1)
                        
                    setDefaultBarFgColor(Color.red1);
                        
                    setDefaultBarThickness(21);   
                    }

                    function 
                    main() {
                        if ( 
                    getBarState()== BARSTATE_ALLBARS) return;
                        if(
                    bInit == false){
                            
                    tHigh high(inv("D"));
                            
                    tLow  low(inv("D"));
                            
                    bInit=true;
                        }
                    //    debugPrintln(tHigh.getValue(0).toFixed(2)+" "+ tLow.getValue(0).toFixed(2));
                        
                    return new Array (tHigh.getValue(0),tLow.getValue(0));


                    ziggy
                    Last edited by z11; 11-04-2007, 07:42 PM.

                    Comment


                    • #11
                      just to followup on this "bug", or at least an anormaly:

                      as the time passed over midnight to November 5, this particular efs started to work fine - current day's high and low started to show correct value for all symbols.

                      the bad news is, a number of other EFSs stopped working .... showing loading data... in their panes...

                      Now I have to go through them one by one to see what is happening...they all involve external symbols and efsInternal and efsExternal usages.

                      ziggy

                      Comment


                      • #12
                        I wonder if anyone could provide some insight to this phenomena:

                        EFSs that work for regular intervals such as 1 minute or 10 minute do not work for intervals of constant range intervals?

                        This occurs when these particular EFSs involve external symbols.

                        Please advise.

                        Thanks alot.

                        Comment


                        • #13
                          ziggy,

                          Did you check the last bar's date on the daily chart? I think in 11/04 evening if the last daily bar's date was still 11/02, high(0, inv("D")) would still return the high of 11/02 instead of the high since the trading started on 11/04.

                          - Clearpicks


                          Originally posted by z11
                          just to followup on this "bug", or at least an anormaly:

                          as the time passed over midnight to November 5, this particular efs started to work fine - current day's high and low started to show correct value for all symbols.

                          the bad news is, a number of other EFSs stopped working .... showing loading data... in their panes...

                          Now I have to go through them one by one to see what is happening...they all involve external symbols and efsInternal and efsExternal usages.

                          ziggy

                          Comment


                          • #14
                            CP-

                            I did check daily chart on 11/4 (at the time of my original post)...and there was a new bar dated 11/4 with correct hi/lo.

                            ziggy...

                            btw, have you figured out any work arounds to drawTextAbsolute problem in v10?

                            Comment


                            • #15
                              For those texts which have to be drawn at certain price level, I periodically redraw them at the beginning of each bars using drawTextRelative(). Otherwise i use drawTextPixel(). Whenever I found some texts disappear due to that bug, I have to manually reload the EFS. :-(

                              Originally posted by z11
                              CP-

                              I did check daily chart on 11/4 (at the time of my original post)...and there was a new bar dated 11/4 with correct hi/lo.

                              ziggy...

                              btw, have you figured out any work arounds to drawTextAbsolute problem in v10?

                              Comment

                              Working...
                              X