Announcement

Collapse
No announcement yet.

Duplicate Ticks

Collapse
X
 
  • Filter
  • Time
  • Show
Clear All
new posts

  • Duplicate Ticks

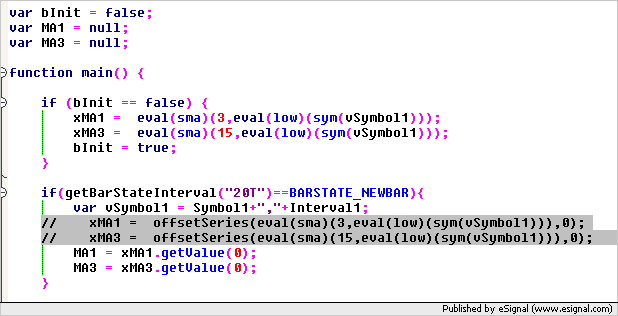
    The following EFS is a simple crossover for 1 min data on a 20T chart of ymm8. Using todays 6/5/08 data, there are duplicate ticks with the same time at 10:11:39 but different data for O/H/L/C. When the EFS runs, it generates <none> as the result for MA1 and MA3 as seen in the data export for the second tick. What causes the duplicates and how do I get around this since it effects the EFS logic.

    Best Regards,

    Alan

    PHP Code:
    var xMA1 null;
    var 
    xMA3 null;
    var 
    aa1 null;

    function 
    preMain() {
        
        
    setPriceStudy(false);
        
    setStudyTitle("  CROSSOVER1Min");
        
    setCursorLabelName("MA1"0);
        
    setDefaultBarStyle(PS_SOLID0);
        
    setDefaultBarFgColor(Color.red0);
        
    setDefaultBarThickness(10);
        
    setPlotType(PLOTTYPE_LINE0);
        
        
    Symbol1 getSymbol();
        
    Interval1 "1";
    }

    function 
    main() {

    if(
    getBarStateInterval("20T")==BARSTATE_NEWBAR){

    var 
    vSymbol1 Symbol1+","+Interval1;

    xMA1 offsetSeries(eval(sma)(3,eval(low)(sym(vSymbol1))),0);
    xMA3 offsetSeries(eval(sma)(15,eval(low)(sym(vSymbol1))),0);
        
    var 
    MA1 xMA1.getValue(0);
    var 
    MA3 xMA3.getValue(0);

    }

    pp = -1;
    qq 1;
    ww 0;

    if(
    MA1 >= MA3) {
                
    aa1 0.5;
                
    setBarThickness(2,0);
    }

        return new Array (
    aa1wwppqqMA1MA3);   


  • #2
    Hello Alan,

    On a 20T chart it could be possible that there were more that 20 ticks that occur within a one second period that would result in multiple bars with the same time stamp.

    The reason you see null values for MA1 and MA3 is because you are declaring them locally and only inside a bar state NEWBAR occurrence for the 1-min interval. Because a 20T and 1-min intervals are of different types, you will see varying results depending on how active the YM market is. When it is very active, you could have more that one 20T bar for a single 1-min bar. On the subsequent 20T bars in this case, your MA1 and MA3 variables do not get created because there wasn't a new bar instance of the 1-min chart. Try the following solution. First you should initial your xMA1 and xMA3 series only once. Use the bIint routine in the example below. Also note, that you do not need to use the offsetSeries() function since you are using an offset value of 0. Then make MA1 and MA3 global variables so that they will store there last known value to avoid the null (i.e. <none>) assignments. You can then assign the values to these variables at the new bar state of the 1-min interval. Hope this helps.

    Jason K.
    Project Manager
    eSignal - an Interactive Data company

    EFS KnowledgeBase
    JavaScript for EFS Video Series
    EFS Beginner Tutorial Series
    EFS Glossary
    Custom EFS Development Policy

    New User Orientation

    Comment


    • #3
      Update

      The following script was updated based on the suggestions. When loaded onto a 20T chart, it says "loading data" for 5 minutes and does not run. I would appreciate debugging sugestions.

      Best Regards,

      Alan

      var bInit = false;
      var MA1 = null;
      var MA3 = null;
      var aa1 = null;

      function preMain() {

      setPriceStudy(false);
      setStudyTitle(" CROSSOVER1Mintestdeletenew");
      setCursorLabelName("MA1", 0);
      setDefaultBarStyle(PS_SOLID, 0);
      setDefaultBarFgColor(Color.red, 0);
      setDefaultBarThickness(1, 0);
      setPlotType(PLOTTYPE_LINE, 0);

      Symbol1 = getSymbol();
      Interval1 = "1";
      }

      function main() {

      if (bInit == false) {
      xMA1 = eval(sma)(3,eval(low)(sym(vSymbol1)));
      xMA3 = eval(sma)(15,eval(low)(sym(vSymbol1)));
      bInit = true;
      }

      if(getBarStateInterval("20T")==BARSTATE_NEWBAR){
      var vSymbol1 = Symbol1+","+Interval1;
      MA1 = xMA1.getValue(0);
      MA3 = xMA3.getValue(0);
      }

      pp = -1;
      qq = 1;
      ww = 0;

      if(MA1 >= MA3) {
      aa1 = 0.5;
      setBarThickness(2,0);
      }

      return new Array (aa1, ww, pp, qq, MA1, MA3);
      }

      Comment


      • #4
        Re: Update

        Alan

        I would appreciate debugging sugestions.
        The first thing you should do is insert a debug statement at the beginning of the bInit routine to check if you are actually passing a valid symbol to the moving average functions when you are initializing the variables xMA1 and xMA3 eg
        PHP Code:
        if(bInit==false){
            
        debugPrintln(vSymbol1);
            
        //rest of your code 
        You may find that you are not actually passing a valid symbol which would be the cause of the script hanging on Loading Data... If that is the case then you will need to ensure that you create a valid symbol prior to initializing the variables. Examples on how to do this can be found in any one of the customXxx.efs formulas which are installed with eSignal in the EFS2 Custom folder
        If instead you determine that are passing a valid symbol then the next step is to add one at a time some debug statements following each line of your code and verify that the values in the Formula Output window match what you should be getting at that point
        Hope this helps
        Alex


        Originally posted by Alan2004
        The following script was updated based on the suggestions. When loaded onto a 20T chart, it says "loading data" for 5 minutes and does not run. I would appreciate debugging sugestions.

        Best Regards,

        Alan

        var bInit = false;
        var MA1 = null;
        var MA3 = null;
        var aa1 = null;

        function preMain() {

        setPriceStudy(false);
        setStudyTitle(" CROSSOVER1Mintestdeletenew");
        setCursorLabelName("MA1", 0);
        setDefaultBarStyle(PS_SOLID, 0);
        setDefaultBarFgColor(Color.red, 0);
        setDefaultBarThickness(1, 0);
        setPlotType(PLOTTYPE_LINE, 0);

        Symbol1 = getSymbol();
        Interval1 = "1";
        }

        function main() {

        if (bInit == false) {
        xMA1 = eval(sma)(3,eval(low)(sym(vSymbol1)));
        xMA3 = eval(sma)(15,eval(low)(sym(vSymbol1)));
        bInit = true;
        }

        if(getBarStateInterval("20T")==BARSTATE_NEWBAR){
        var vSymbol1 = Symbol1+","+Interval1;
        MA1 = xMA1.getValue(0);
        MA3 = xMA3.getValue(0);
        }

        pp = -1;
        qq = 1;
        ww = 0;

        if(MA1 >= MA3) {
        aa1 = 0.5;
        setBarThickness(2,0);
        }

        return new Array (aa1, ww, pp, qq, MA1, MA3);
        }

        Comment


        • #5
          Ticks

          Alexis and Jason,

          Thank you for your support. The script works great based on your input.

          Best Regards,

          Alan

          Comment


          • #6
            Alan
            You are most welcome and I am glad to hear the script is now working fine
            Alex


            Originally posted by Alan2004
            Alexis and Jason,

            Thank you for your support. The script works great based on your input.

            Best Regards,

            Alan

            Comment

            Working...
            X