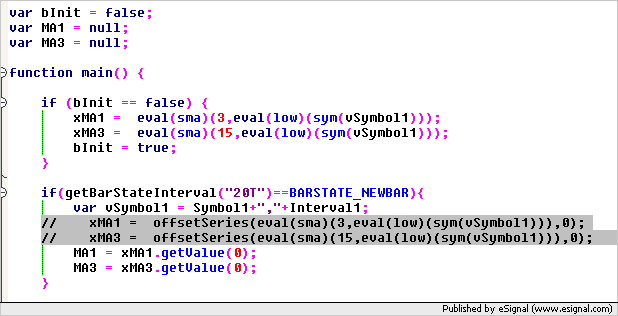
The following EFS is a simple crossover for 1 min data on a 20T chart of ymm8. Using todays 6/5/08 data, there are duplicate ticks with the same time at 10:11:39 but different data for O/H/L/C. When the EFS runs, it generates <none> as the result for MA1 and MA3 as seen in the data export for the second tick. What causes the duplicates and how do I get around this since it effects the EFS logic.
Best Regards,
Alan
Best Regards,
Alan
PHP Code:
var xMA1 = null;

var xMA3 = null;

var aa1 = null;


function preMain() {


    setPriceStudy(false);

    setStudyTitle("  CROSSOVER1Min");

    setCursorLabelName("MA1", 0);

    setDefaultBarStyle(PS_SOLID, 0);

    setDefaultBarFgColor(Color.red, 0);

    setDefaultBarThickness(1, 0);

    setPlotType(PLOTTYPE_LINE, 0);


    Symbol1 = getSymbol();

    Interval1 = "1";

}


function main() {


if(getBarStateInterval("20T")==BARSTATE_NEWBAR){


var vSymbol1 = Symbol1+","+Interval1;


xMA1 = offsetSeries(eval(sma)(3,eval(low)(sym(vSymbol1))),0);

xMA3 = offsetSeries(eval(sma)(15,eval(low)(sym(vSymbol1))),0);


var MA1 = xMA1.getValue(0);

var MA3 = xMA3.getValue(0);


}


pp = -1;

qq = 1;

ww = 0;


if(MA1 >= MA3) {

            aa1 = 0.5;

            setBarThickness(2,0);

}


    return new Array (aa1, ww, pp, qq, MA1, MA3);

}

Comment