Announcement

Collapse
No announcement yet.

New Scripts

Collapse
X
 
  • Filter
  • Time
  • Show
Clear All
new posts

  • I uploaded a new script to my Specialty Scripts group in File Share that calculates and plots Average Daily Range bands. Link to File Share:

    http://share.esignal.com/groupconten...ge&groupid=114

    Chris
    Comment


    • Something odd....

      Chris,

      When I change from a 1 to 5 to 15 minute chart the ADR study gives different boundry levels with each different time segment.

      Any idea why this is happening? Shouldn't the boundry levels remain the same for all time segments?

      Comment


      • The logic used is as follows:

        1. At the start of each new day, the Average Daily Range for the past X days is calculated (where X is the number of days you specify).

        2. As each new bar comes in during the new day, the calculated Average Daily Range is added to the lowest-low of the day so far and the Average Daily Range is subtracted from the highest-high of the day so far.

        3. At any point during the day, then, it shows you how much further the security would need to travel to hit the Average Daily Range.

        Chris

        Comment


        • Boundry change

          The logic is good. As usual another excellent idea for an EFS.

          My problem is that the EFS gives different levels when you change the time interval on the intraday chart.

          If you could check your own charts to let me know if something is wrong from my side I would appreciate it.

          5 days on AB M4
          Then look at a 5, 15 and 135 minute charts

          I get readings for the upper boundry at 551, 550.10 and 549.20, respectively.

          A 2 point difference is quite a bit. Which one is correct?

          Comment


          • Himalaya
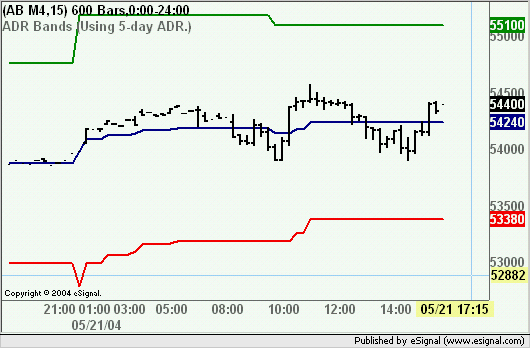
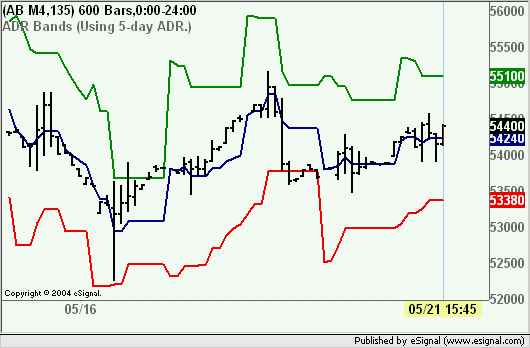
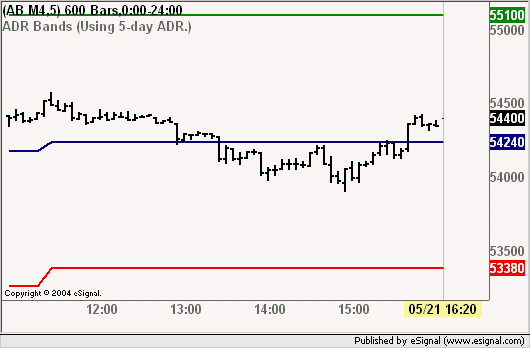
            FWIW I am not seeing that at my end (see images below).
            You may want to check that the Time Template used on that chart is covering the same amount of time (ie days/bars loaded) for each interval
            Alex


            Comment


            • Himalaya:

              I tried it on my end and got the same results as Alex did, 551 across the board for all time intervals. Alex is correct... it must be the Time Template.

              Chris

              Comment


              • Yep, time template

                Yep, seems like a time template issue.

                Thanks Chris, Alex

                00:00 - 24:00 Dynamic gives constant readings

                6:30 - 13:15(PST) Dynamic gives different readings for each interval

                Comment


                • Historic VP

                  Chris, is there a way to have your Historic VP script choose specific dates to calculate from?

                  For example, if you were looking at 10 day profiles you could look at 4/10/04 - 4/20/04 or 5/10/04 - 5/20/04.

                  As long as the chosen dates matched the chosen lookback period?

                  Thanks in advance

                  Himalaya

                  Comment


                  • Himalaya:

                    Are you saying that you would want to be able to input a start date/end date and have the script use those days to calculate the VP projection for today (as opposed to just using the last X days which it does now)?

                    Chris

                    Comment


                    • Yes!

                      Chris,

                      Thats correct.

                      It would then be possible to get historical POCs, VAs for backtesting (manual) purposes

                      With some quick clicking one could acquire an x day POC going back the life of a contract or as far back as Esignal holds data

                      Note: The script as it is is excellent and I have started to keep the levels it provides in a spreadsheet. I have seen good results with a strategy that keys off of those levels. I am tying to get more historical levels and I thought this would be a good way to do it. If its possible

                      Himalaya

                      Comment


                      • Himalaya:

                        You have to understand that the lookback would be limited by your time template since a script can only access the amount of data defined in the template. Also, the max number of days of intraday data that can be requested is, I believe, 120 so that would be the ceiling in terms of how far back you could go. In any event, when I have some free time over the next few weeks I will see what I can do about implementing a date range to replace the current logic.

                        Chris

                        Comment


                        • moving averages

                          You guys totally lost me. What I was asking, is there a way to put 10,20,40,47 ma's on a 5 min chart at once? Thanks again. bohurst

                          Comment


                          • bohurst
                            I believe you are reading the wrong thread.
                            You posted your question in this thread where you will find the reply
                            Alex

                            Comment


                            • I uploaded a few new files to the Specialty Scripts group today.

                              DynamicRSI.efs - a standard RSI indicator with self-adjusting upper and lower bands.

                              ModifiedMA.efs - More reponsive moving average based on TASC article.

                              TriangleWeightedMA.efs - EFS implementation of a triangular moving average.

                              Link to File Share:

                              http://share.esignal.com/groupconten...us&groupid=114

                              Chris

                              Comment


                              • EFS implementations of both Renko and Kagi charts uploaded to the Specialty Scripts group.

                                Link to File Share:

                                http://share.esignal.com/groupconten...r=&groupid=114

                                Chris

                                Comment

                                Working...
                                X