Announcement

Collapse
No announcement yet.

Interesting Chart Patterns To Monitor In Coming Days...

Collapse
X
 
  • Filter
  • Time
  • Show
Clear All
new posts

  • An updated ES chart......the next few days look to be very interesting....


    As always, any thoughts, comments, or additional charts are welcomed....

    Comment


    • Hi Duane.

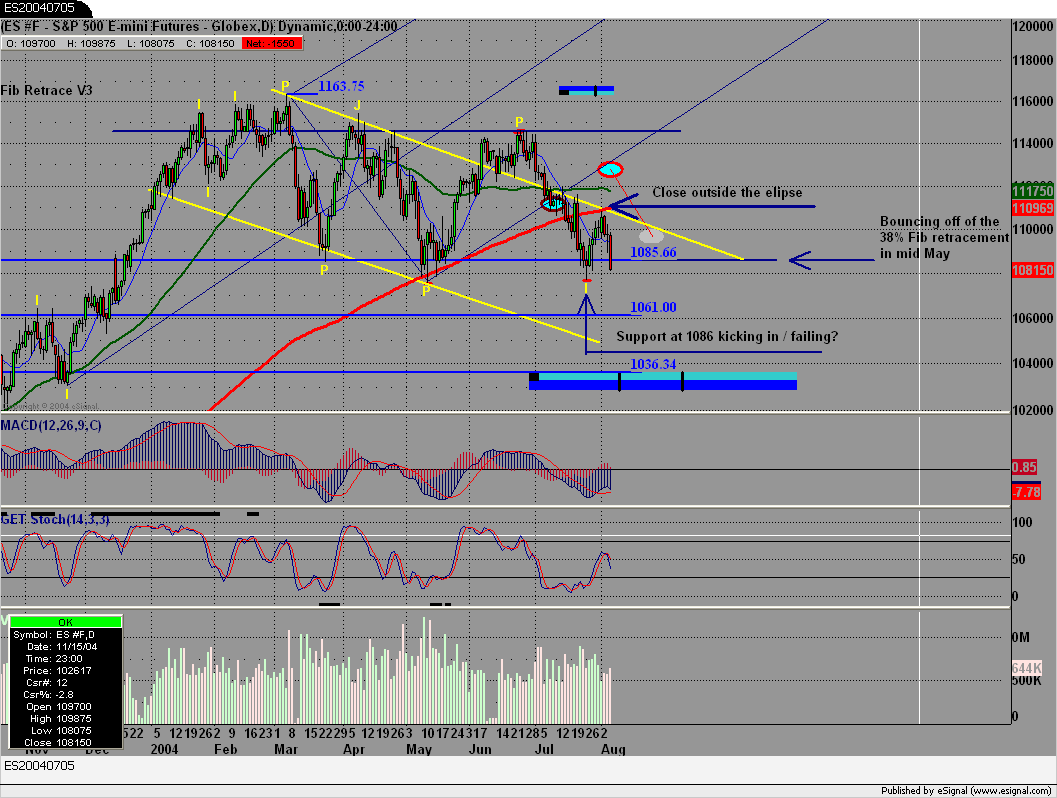
      Originally posted by DuaneG
      An updated ES chart......the next few days look to be very interesting....
      As always, any thoughts, comments, or additional charts are welcomed....
      Sorry I haven't had time to post since returning from vacation. Only have a few moments, so will be brief....

      The SP-- as well as the Dow Industrial and Nasdaq-- is (are) finally entering a critical junction where stronger 'profit-taking' is imminent.
      The only thing, I think, which keeps this from happening is if we can get another strong wave of selling in the Energy futures contracts
      like we did yesterday. (There still is a good possibly this could happen.) If energy sells off within two weeks, the SP will establish a
      temporary bottom and build for a strong 'oversold' condition rally.

      That is my quick guess....

      Hope to get more time soon to come back and visit again.

      Marc

      - - - - - - - - - -
      Attached Files
      Marc

      Comment


      • Duane,

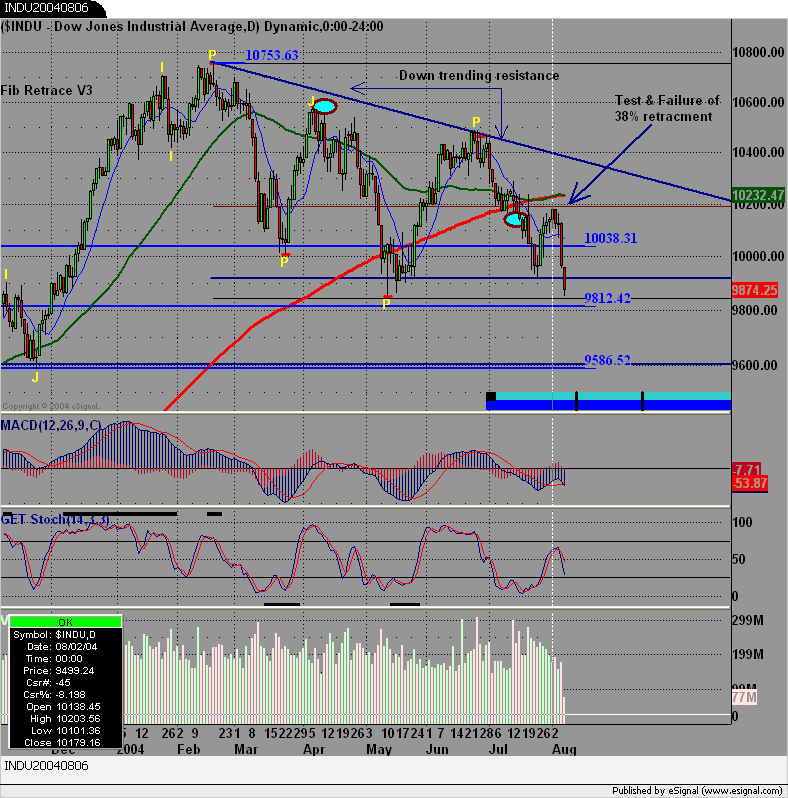
        Here is a 'quick look' Dow chart.... Notice since the orginal post back on 6-1-04 it rallied into the Normal Ellipse
        and it held. Interesting.... watching for same scenario as with SP500 contract.

        Best wishes,

        Marc
        Attached Files
        Marc

        Comment


        • Look at the weekly ES...there is a clear down channel line that hasn't really been violated on a daily basis. Explains a lot of the recent action (been very playable). Doesn't mean it will not break someday (in fact it will at some point in time), but it looks pretty strong.

          G
          Garth

          Comment


          • Nice to see you back on the board Marc. Hopefully the vacation was a restful one. Thanks for the charts of the DOW. Here is what I came up with.....

            Comment


            • Like I said yesterday...
              Originally posted by MR - Posted: 08-05-2004 05:54 PM
              The SP-- as well as the Dow Industrial and Nasdaq--
              is (are) finally entering a critical junction where stronger
              'profit-taking' is imminent....
              Monitor next week for any selling off in energy futures complex.
              IF it happens, we might get a temporary reprieve.
              Have a good weekend,

              marc
              Attached Files
              Marc

              Comment


              • Marc,

                Thats a great set-up I never thought of that.

                That visual will make it much easier on me!

                Sweeeeeeet!

                Fibbgann
                Excellent book on JavaScript for beginners

                Comment


                • P%F Target coming in at 1,000

                  http://stockcharts.com/def/servlet/SC.pnf?c=$SPX,P&listNum=

                  Comment


                  • Hello Fibbgann!

                    Thanks. Always trying to
                    think outside the box, so
                    to speak. Hope it helps!

                    Best wishes, and good
                    luck next week!


                    Marc
                    Marc

                    Comment


                    • Over the weekend I was able to update some previous charts.... Here is FBR daily:
                      Attached Files
                      Marc

                      Comment


                      • Here is another update:


                        Last edited by MR; 08-09-2004, 07:24 AM.
                        Marc

                        Comment


                        • One more update, CY:
                          Marc

                          Comment


                          • Follow-Up on a GT 'high volume' question w/chart attached....
                            Marc

                            Comment


                            • Here are CPS and EVG previous post
                              comment with current follow-up charts...
                              they did go up a couple bucks afterwards,
                              but then broke down... is why I like to use
                              6/4 DMA's as guides, always keeping an
                              eye on potential divergence building.
                              Again, this was just very quick trade idea
                              when posted, not a typical Type 1 buy.
                              Attached Files
                              Marc

                              Comment


                              • Here is an update where I was totally wrong in my impressions. I even bought GM with real money and took a loss on it.
                                Then later I commented on follow-up parameters to watch for, and even that did not pan out.

                                I wanted to show you this follow-up chart to show how the Ellipse study can be helpful for 'directional guidance.'
                                When 'time and price' converge with the the Ellipse arrival, if it does not stop the swing move, it strongly suggests that swing will continue.
                                (is why I had to stand aside since)....
                                Last edited by MR; 08-10-2004, 07:00 PM.
                                Marc

                                Comment

                                Working...
                                X