Announcement

Collapse
No announcement yet.

Interesting Chart Patterns To Monitor In Coming Days...

Collapse
X
 
  • Filter
  • Time
  • Show
Clear All
new posts

  • HTCH daily... worth tracking closely next few weeks.
    (See chart below with comments on it.)
    Attached Files
    Marc

    Comment


    • Hi David,

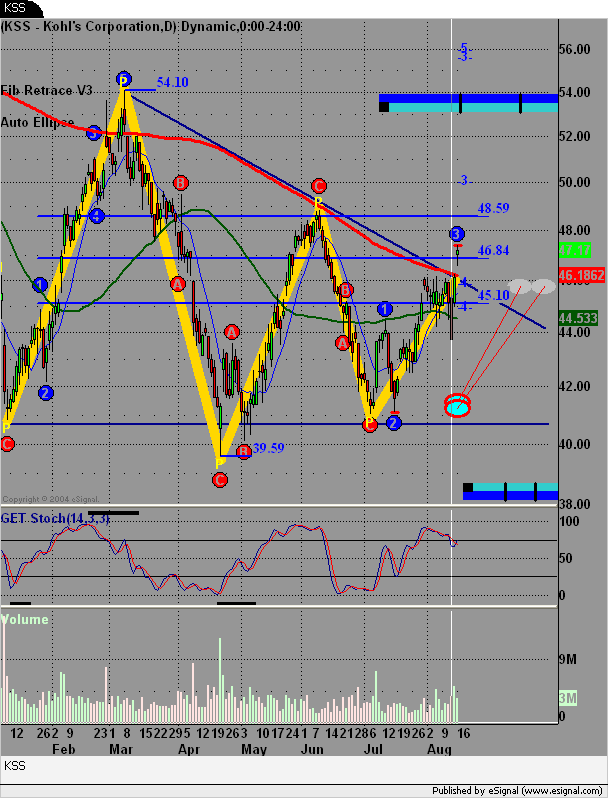
      I just wanted to congratulate you on your earlier analysis on KSS. We didn't quite get a breakout bar from the regression trend channel, but nice move nonetheless. Good job!!

      Comment


      • Duane, wasn't that your stock too from a while back? You both deserve congrat's for a job well done!
        Marc

        Comment


        • Here is another recent Wave 3 stock chart, HET daily. Worth watching more
          closely for pullback and possible Type 1 setup someday?
          Attached Files
          Marc

          Comment


          • Hi Marc,

            Thanks! David and I played KSS on different days and using different types of analysis, but the results were pretty good in both scenarios. Here is the chart from my initial post on KSS.

            Comment


            • ORCL worth watching more closely the next couple months. Sample quick look chart attached.
              Attached Files
              Marc

              Comment


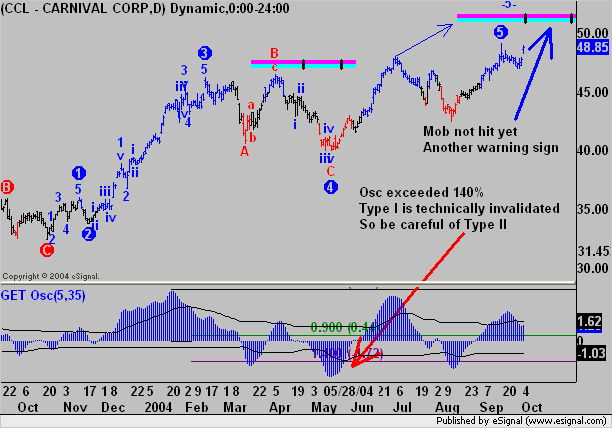
              • Here's a possible Type II on CCL... but there's a few risk factors to be concerned about. Marc, how's this look from your perspective? I'm thinking on waiting until it gets closer to the MOB.

                Regards,
                Jay F.
                Product Manager
                _____________________________________
                Have a suggestion to improve our products?
                Click Support --> Request a Feature in eSignal 11

                Comment


                • Here's another... slightly different.

                  Regards,
                  Jay F.
                  Product Manager
                  _____________________________________
                  Have a suggestion to improve our products?
                  Click Support --> Request a Feature in eSignal 11

                  Comment


                  • Jay,

                    I honestly don't know unless I can do a great deal of analysis to figure it out. Picking major tops or bottoms with stocks is a much harder to do than people realize. I usually end up having to use ever tool in the book to build great confidence in a possible Type 2 weekly or daily stock chart. Let's just say, as of today, I am not personally inclined to sell very much yet these two stocks other than maybe very aggressive trades with very aggressive trailing stops attached to protect the position at the right time and price. On a quick glance, I don't think the major tops are here yet on these two stocks. I will save these symbols and track them for a while, maybe can get a better feel for them then?

                    Marc
                    Marc

                    Comment


                    • Thanks Marc for your opinions. I'm tending to agree. With the elections coming soon, and Crude Oil and ES fut's at a critical decision point (right in a MOB on Daily,) I'm hesitant to pull any triggers until things look more decisive.

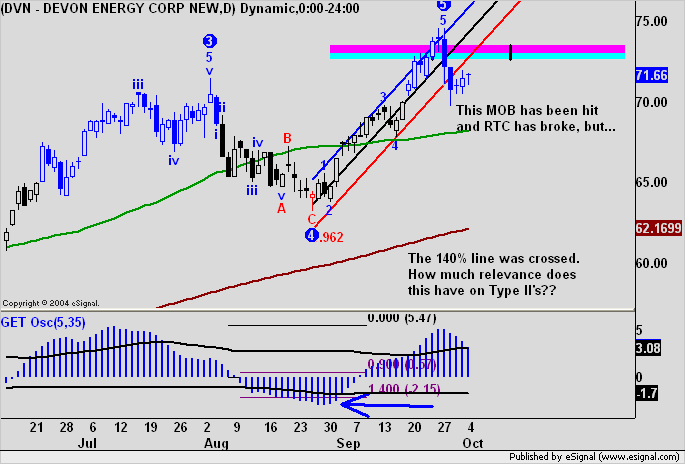
                      As a general GET question, does the 90%-140% Osc break have much relevance on a Type II trade? I know with Type I it's vital, but Type II's... well, they are a bit foggier of a trade for me.
                      Regards,
                      Jay F.
                      Product Manager
                      _____________________________________
                      Have a suggestion to improve our products?
                      Click Support --> Request a Feature in eSignal 11

                      Comment


                      • Jay,

                        The 1.4 thing is more critical for setting up Type 1's. Not as critical for Type 2's. There is some relationship with a Type 2, but not totally like with the Type 1's.

                        Marc
                        Marc

                        Comment


                        • HGSI idea, chart attached.
                          Attached Files
                          Marc

                          Comment


                          • Hi Marc,

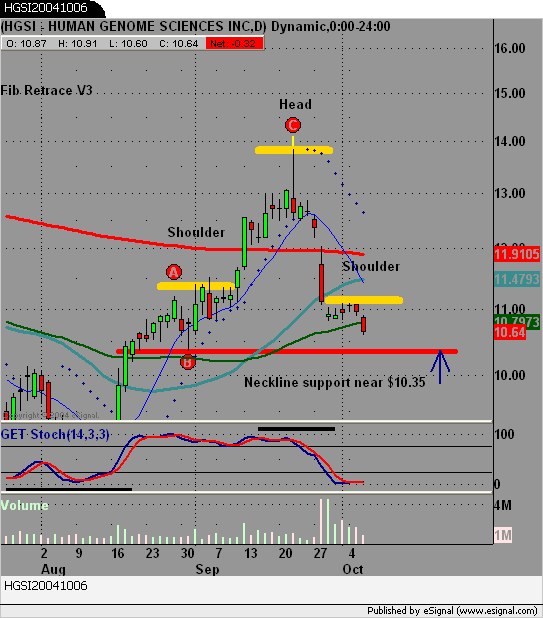
                            Nice spot. Here is different look at HGSI. It's a little tough to see with my normal bar spacing, but once I opened it up, it became much more clear. Thoughts?

                            Comment


                            • Duane,

                              It certainly is possible...
                              My bet is the neck gets broke
                              because their is no other support
                              below this area other than minor.
                              Just a guess...

                              Marc
                              Marc

                              Comment


                              • Still am holding long 100 shares of FCX (See attached chart). Betting this is
                                still a Wave 3 in progress. Might use a simple trendline for a trailing stop idea.
                                Attached Files
                                Marc

                                Comment

                                Working...
                                X