Announcement

Collapse
No announcement yet.

Interesting Chart Patterns To Monitor In Coming Days...

Collapse
X
 
  • Filter
  • Time
  • Show
Clear All
new posts

  • US Dollar breakout of six month trading range, bottom basing pattern.
    After DX decline since 2002, are we witnessing the beginning of dollar
    strengthening for a few months? IF someone wants me to trade for them,
    I can show you how to take advantage of this.... (smile, my futures
    account is closed right now so I can only watch... bummer.)
    Marc

    Comment


    • On the other side Euro now vulnerable to decline to 1.23 next target?
      Might hold next week 1.25, but before June push lower, working to 1.23
      this summer????? Just a guess?
      Marc

      Comment


      • PTI < 35 ?

        Originally posted by MR
        Just bought a little of BG...

        Lot's of ideas, not enought money to do it all...

        Oh well, maybe someday will get smart and let me helpt them manage money

        I wish I had deeper pockets sometimes...
        Hello Mark, it doesnt rain but it pours, thats the way the opportunities come I guess.

        With regard to ths chart, you have entered with a low PTI, so the theory seems to indicate that the previous wave 3 may not be exceeded ie a double top of sorts, could you explain your reasoning on this one please.

        Thanks, your tips are much appreciated

        Comment


        • Hi Ainsley!

          I compensate for trades where not all the primary parameters are supportive by taking smaller positions.
          While the PTI is less than 34, it is still above 30. I find this acceptable for a PTI.

          Other than that, I like this trade. If I am wrong I will only lose a little bit with a smaller position.
          Also, I might cover it quicker if changing conditions warrant it.

          When you trade you take the best you can find for that day. If we waited for perfection
          sometimes we still might be waiting. Hope this helps.
          Marc

          Comment


          • Regarding MR's BG position, I would have thought another indicator would be to track the 5,35 for the W5 position and as it looks to peak higher than the existing W3, the elliot position will recount and place the new high as a W3.

            When in this position I sometimes keep testing the count with the alternate 3 - long term ellot option to see if the count stays as a W5 or switches to a W3.

            Any comments on this type of early test for a Wave recount ?

            Cheers
            Regards
            Philby

            Comment


            • A sound technique. Checking wave counts on other time frames also helps. For example, BG was a 90 minute chart. Maybe back check it with the 30, 45, 60; and forward check wave counts on 120, 180, 240, 480, daily? If the wave counts are similar that is encouraging as well. Some people use other time frames as well.
              Marc

              Comment


              • GR hourly interesting, MSO 240 min showing W3 still in progress.
                Marc

                Comment


                • Home Depot (HD)

                  I sent the following email to my friend, Mike, yesterday afternoon concerning buying
                  Home Depot (HD) yesterday. I was being conservative in my comments since he is
                  a friend and does not know technical analysis very well.

                  At this point watch for it to gap cover some... eventually to work higher.
                  (see HD daily chart, below)
                  - - - - - - - - - - - - - - - - - - - - - - - -
                  Date: Mon, 16 May 2005 15:18:57
                  From: Marc Rinehart
                  To: Mike
                  Subject: HD

                  "HD... I think you asked about this stock last month. It is lifting
                  the Dow today with good comments on it. Hard to quantify as a
                  position, but if you were interested in it, you could buy it today and
                  place a stop either below today's or last weeks low, just below 36.
                  It would have to rise more the next two weeks or it could end up
                  collapsing down again to 35 area. It is only a 50-50 trade, but
                  really good if you are looking for a good risk-reward trade... If it can
                  breakout of the recent downtrend from 33 to 35, then it could very
                  easily drift back to 40's area. Again, is only an aggressive idea ...
                  If it doesn't work out soon, you could return to it later in next
                  couple months to try another play. My guess is it will breakout soon
                  and try to get back to 40ish?"
                  Attached Files
                  Marc

                  Comment


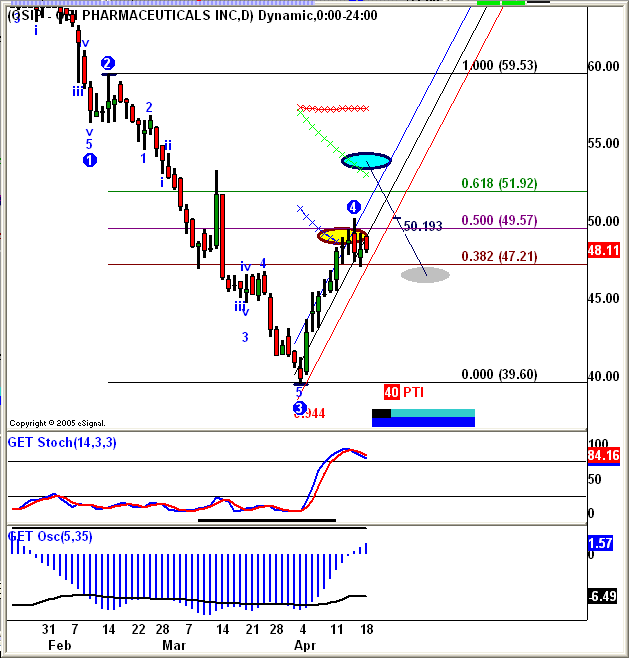
                  • I just wanted to post a follow up to the TYPE I Sell of OSIP that I mentioned on 4/18. While the price hasn't yet reached the MOB, the price action has behaved as expected and given us a pretty decent run. As always, this is for educational purposes only.

                    So far, we've captured nearly six points.....

                    Here's a look at how it played out.

                    April 18, 2005


                    May 17, 2005

                    Comment


                    • Very good job, Duane! Excellent! Keep posting more ideas here!
                      Marc

                      Comment


                      • Hello,

                        my english is not very good! Many thanks to Marc and DuaneG!

                        Can you tell me, what the Pearsons R<0.9 means? Is this in the AGET EOD Version too?

                        Viele GrĂ¼sse Catano

                        Comment


                        • Hi Catano,

                          To understand Pearson better Click on RTC article and read. It will take you to something I wrote in the
                          File Share, Advanced GET group, into the RTC folder. Read PDF titled Overview of Regression Trend Channel.

                          Quick Person explanation:
                          The most effective use of the Regression Trend Channel (RTC) would be when a "single sloped" market is
                          identified (in simple terms: when a market that is moving in a very linear manner) to begin to apply the RTC
                          for a potential breakout pattern. The use of Pearson's helps identify that linear relationship. If a market is
                          "curve fitting" well-- some would say a Pearson's value of 0.90 to 0.93, or greater, is what you want to see for
                          a "tight fit"-- you can now begin to setup for a trade opportunity of the break of channel line in that tight fit.


                          Hope this helps.
                          Marc

                          Comment


                          • Mark, thanks for sharing your thoughts, it's good to see some ideas finally starting to hit this board, might mean I will have to post something soon LOL

                            Comment


                            • Hi gelfont!

                              Thanks for your thanks! Please feel free to post your ideas here. It is nice to see the market coming
                              to life again. It might be the beginning of a good summer of trading! Hope this action continues.

                              Best wishes, Marc
                              Marc

                              Comment


                              • Tip today:

                                Look at CKCM 120, 90. 60, 45 and 30 minute charts.
                                Type 1 buy action today on all those time frames?
                                Good synergy in pattern is a positive.
                                Marc

                                Comment

                                Working...
                                X