Announcement

Collapse
No announcement yet.

Interesting Chart Patterns To Monitor In Coming Days...

Collapse
X
 
  • Filter
  • Time
  • Show
Clear All
new posts

  • Here is a very simple current GC#F daily chart, or how I am
    looking at it from a trader's point of view. - marc
    Attached Files
    Marc

    Comment


    • Feeling confident of KRY daily chart's potential the rest of this year....
      (see attached chart)
      Attached Files
      Marc

      Comment


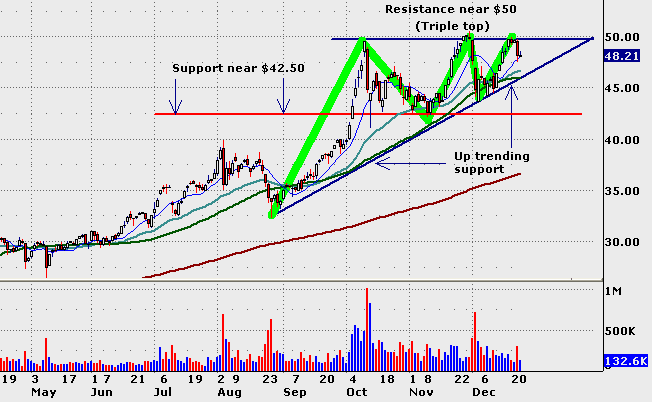
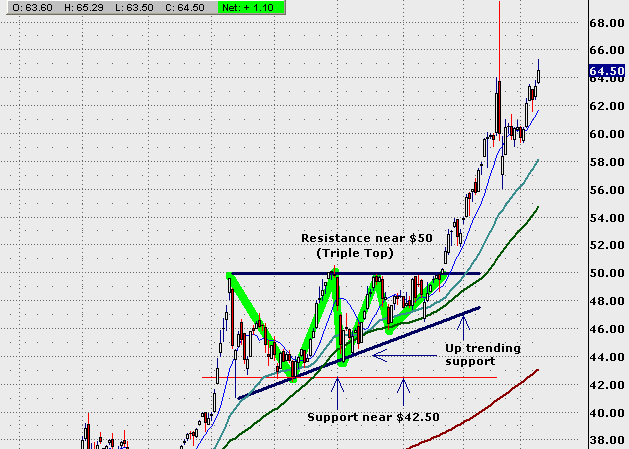
      • Here is a picture of what I was looking at when I decided to buy 1,000 shares of TSCO this week. I have seen a lot of charts over the years, and the weekly Feb 3rd breakout of one year of orderly Wave 4 correction, to me, was a bullish sign. Since then, we had a month to consolidate. When I looked at a time frame between a daily and hourly (240 min) I became convinced this one was worth an aggressive buy. I see it as an internal Wave 4 ready to go up again. If I am correct, 42 to 41.30 should hold now and we should attempt to another rally. I will show you soon a similar pattern I posted here last year. Check out and see what happened with it. It is encouraging...
        Attached Files
        Marc

        Comment


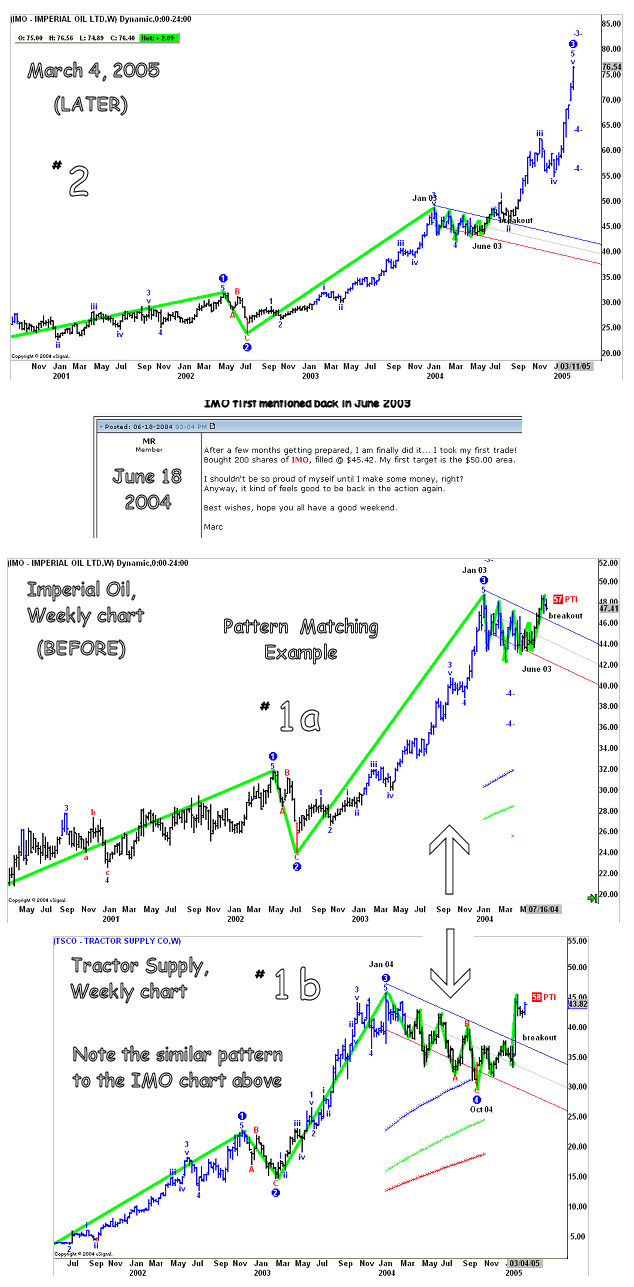
        • Here is the pattern matching example I was talking about earlier today.
          There are no guarantees the same result will happen with TSCO that
          happened with IMO. At least it makes a good educational example
          of the pattern matching concept. - marc

          Marc

          Comment


          • I haven't posted in this thread for a while, but I wanted to illustrate a pattern I've been following for a while now. This a daily chart of BPT. The initial analysis was done in late December of '04.

            All in all, the oscillations were a little sloppy, but the breakout was sound. As always, thoughts and comments are welcome.

            December 26, 2004


            March 9, 2005

            Comment


            • Duane, Nice pattern, I would be interested in finding similar patterns that are currently forming, any goo d ideas out there would be welcome, is there a formula to ge the green zigazag lines in esignal? Or did you manually draw them?

              Comment


              • Hi Gelfont,

                Thanks for the comments. In regards to tracking down these types of patterns, I usually review about 4000 to 5000 patterns a week. I usually don't spend more than 5-10 seconds on each one. My paranoid nature of missing a good pattern has me looking at more rather than less.

                The lines on the pattern were drawn in manually to highlight the intra-pattern oscillations. I don't know of any EFS studies that would do this sort of thing, but I'll keep my eyes open and respond back if anything comes up. Thanks.

                Comment


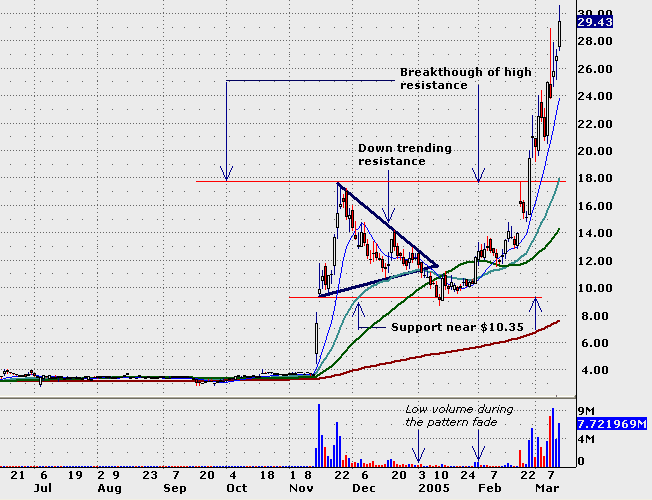
                • During my weekend research I like to follow up with some of the ideas that I've been working with....Here's another...As always, these are examples and for educational purposes only...Have fun.

                  BOOM January 02, 2005


                  BOOM March 13, 2005

                  Comment


                  • Duane,

                    Nice charts and good work! Just curious, could Advanced GET tools or studies helped you trade these setups in anyway?
                    Marc

                    Comment


                    • Jay,

                      Here is an update on CMCSK. It's the best current stop I can think of....
                      (I captured the image before the market opened.)

                      Hope things are well with you.

                      Marc
                      Attached Files
                      Marc

                      Comment


                      • TSCO is looking like it might want to test the gap, maybe cover it before working higher again? Defensive a little right now.
                        Marc

                        Comment


                        • Tom,

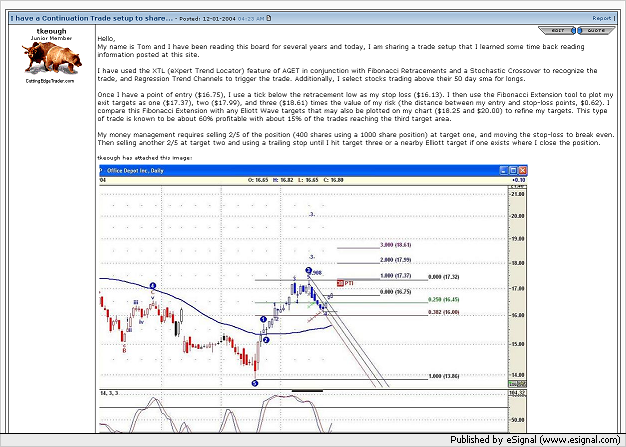
                          I wanted to review your previous two posts on ODP (Office Depot) and thank you for posting
                          them here back in December.... Here is a captured image of the first....

                          Marc

                          Comment


                          • Tom,

                            Here is a captured image our your ODP (Office Depot) update back in December....

                            Marc

                            Comment


                            • Tom,

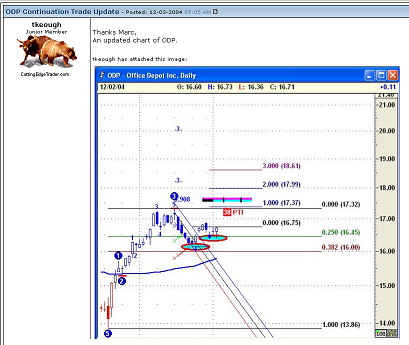
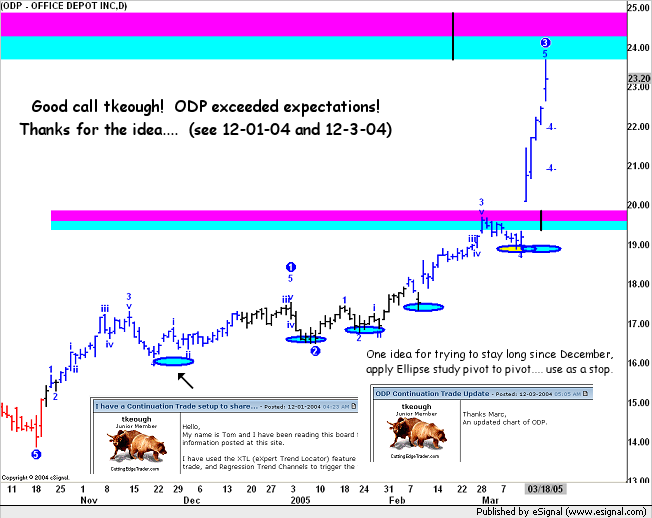
                              ... and finally, here is the recent update picture of ODP (Office Depot).... the only idea I have
                              that might have helped you stay in it longer would be if you used a normal ellipse in a pivot to
                              pivot application. It isn't a standard technique, but it does work a lot of times when trying to stay
                              in a continuation.

                              Take care, and remind me when we get a Type 1 buy setup in this stock... might be interested.

                              Marc


                              Marc

                              Comment


                              • Duane,

                                Remind me when you see a Type 1 Buy setting up in BOOM. Might be interested.
                                Thanks!

                                Marc
                                Marc

                                Comment

                                Working...
                                X