 Tweet
Tweet
-
Fabrizio L. Jorio Fili -
Comparison Analysis & Expectations
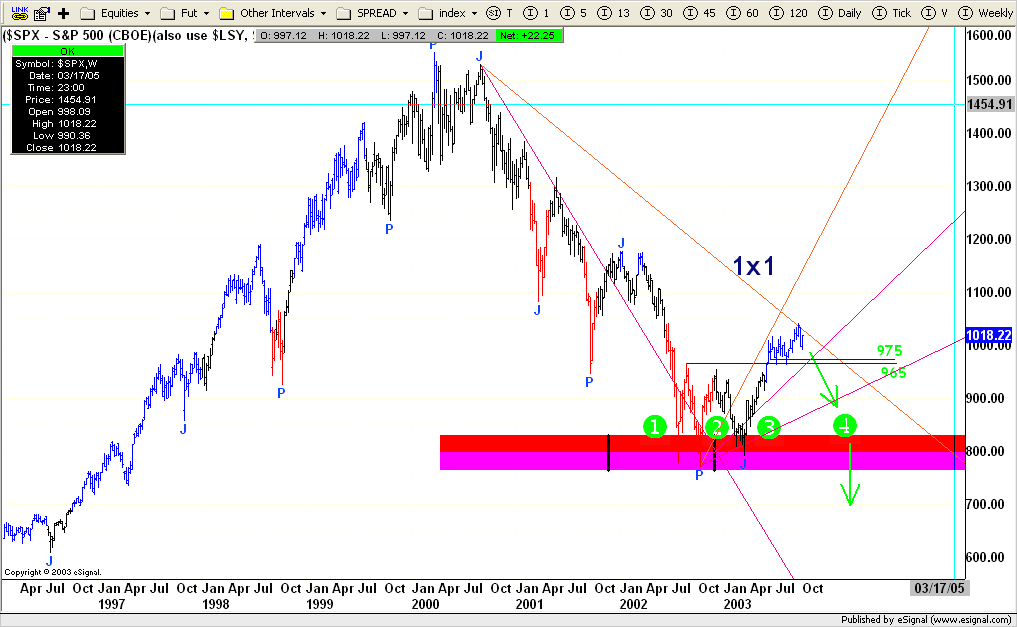
Great chart Fabrizio! Here's another perspective using jeffvision <g>
I also welcome Marc and all others to the forum, all comments
and contributions appreciated for the insight and experience they
come with. Thankyou in advance.
Sorry, for the clutter.....I had to add the Gann circles.....I don't
have squares or triangles<g> yet? BTW, I'm making comparison
observations on the years, 1998, 1999,2002, 2003, 2004<g>

Leonardo Fibonacci was a 12th century mathematician who was believed to have discovered a
naturally recurring ratio in sequences of numbers. The Fibonacci "Golden Ratio" of .618 continually shows
up in both nature and the markets. WD Gann was probably the first trader to use Fibonacci
retracements and the Fib ratios of .382, .50 and .618 are very close to the Gann numbers of 3/8, 4/8 and 5/8,
which Gann used over and over in his chart calculations. Retracements are calculated from recent significant
price highs and lows or pivot points. The ratios that appear most frequently in the stock and futures
markets are .382, .50, .618, .786, 1.00, 1.272 and 1.618 and are used for both price and time analysis.
Good Trading,
~j
Last edited by JJordan; 10-02-2003, 05:07 AM.Comment
-
Jeff, Fabrizio:
Forgive me for being ornery today... but here is my Gann!
... you just have to look beyond the chaos for some meaning.
This basically is what the Auto Gann tool is about but it filters
out the angles other than the most relevant for immediate price.Attached FilesMarcComment
-
-
Marc
Love it.
But, I cannot find Waldo!!Fabrizio L. Jorio FiliComment
-
Line Studies
Originally posted by MarcRinehart
Jeff, Fabrizio:
Forgive me for being ornery today... but here is my Gann!
... you just have to look beyond the chaos for some meaning.
LOL, Love it! I've been trying to find a kaos background image
for my charts.....that's a fine wallpaper you picked!<g>
Line Studies Line studies are technical analysis tools
that consist of lines drawn on top of a security's price and/or indicator.
These include the support, resistance, and trendline concepts already discussed.
BTW, Try not to put all the line studies on one chart!<g>
Good Job though.....keep pushing the envelope, those that
can see thru the chaos survive for another day. God Bless the adventurer.
~JLast edited by JJordan; 10-02-2003, 09:42 AM.Comment
-
If, as Paul Harvey would say, "you want to see the rest of the story...." visit the AGET Gold thread later today when I post another weekly Gold chart showing how to make all that Gann angle information more meaningful. (click here to review that link)
PS - Fabrizio, under the Ellipse, by Wave 4... Waldo is shy... Marc
MarcComment
-
Anxious Market....if not, should be?
We are truly living in interesting times. Risks are increasing
IMO as big banks and bankers and governments speculate on the future.
Caution is a must when interpreting world economics.
Financial speculation and phoney economic growth isn't REAL GROWTH!
Real wealth comes from savings and investments and the production of real goods.
It doesn’t come from financial speculation. Printing money and expanding leveraged financial
assets that trade the markets is paper wealth—not real wealth.
Selling our assets to foriegn producers isn't growth! Consumption and debt growth isn't the answer!
Last weeks amazing reversal.

Speculation and greed in the hands of a few is dangerous.
Citigroup was the top net earner in 2002.( A very bad year for the market)

Japan and China are investing in our assets while paying higher interest rates on their own debt?

IMO, a sudden rise in interest rate or drop in the Dollar is not
good for our economy. The risks from imbalances.....Last edited by JJordan; 10-06-2003, 07:39 AM.Comment
-
watching...The Big Bad S&P
My what big eyes you have.?......the better to see you with my dear
Comment
-
SP500 Daily Trend
We have the daily MACD and Stochastics in bullish posture.
 Last edited by JJordan; 10-13-2003, 06:37 AM.
Comment
-
Real wealth comes from savings and investments and the production of real goods.
Sound speaking JJ. Reflation )monetary policy from the Fed) is the name of the game.Fabrizio L. Jorio FiliComment
-
Re: Mountains, Peaks and Valleys - All must be overcome
Originally posted by JJordan
Do it right or do it wrong, it's all right......
Looking for market opportunities is like looking for patience.

Some call it timing some call it faith, others gambling?

Comment
-
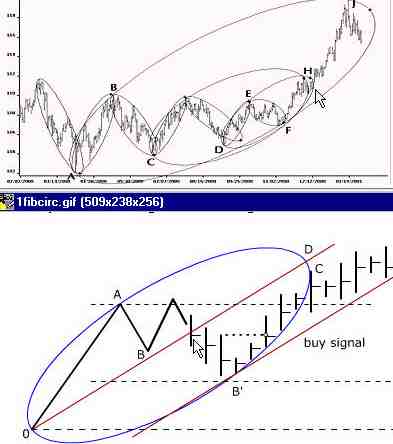
Eclipses, circles and fibonacci ideas, con't.
Originally posted by linus71
my suggestion for the future is the Composite could rise
further moving within its trend channel (Chart is Nasdaq)
Linus
A good chart and analysis previously posted by Linus:
Now if we had an elliptical circle tool. (ovals, triangles & squares)
.....we could play with fibonacci
some more...
Last edited by JJordan; 10-22-2003, 09:30 AM.Comment
-
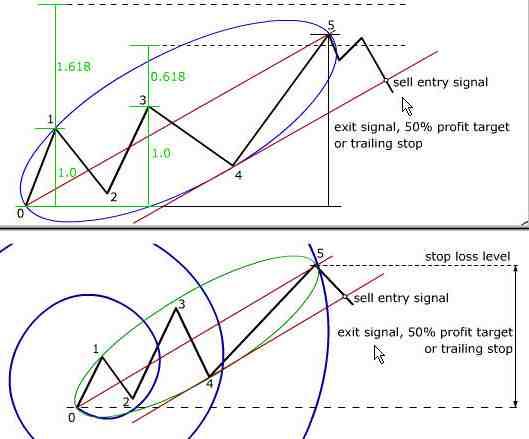
Trend channel con't.
the Composite could rise
further moving within its trend channel (Chart is Nasdaq)
I didn't intend to publish this chart(not very clean), but find the pattern
worth studying as the trend seeks it's conclusion. The
questions some will ask is; Have we seen the highs....or
continue toward 50% year? Watch your trend channeeel!
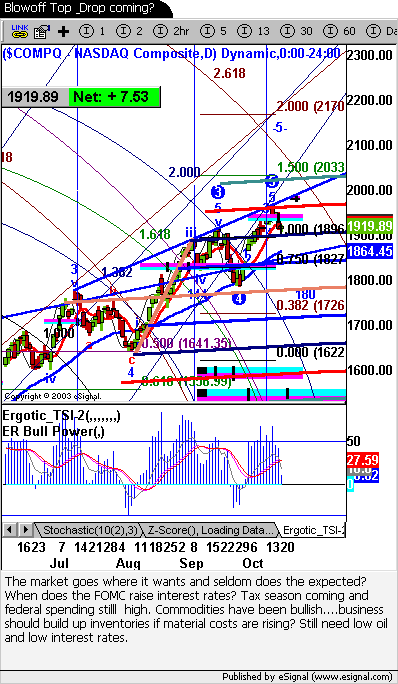
~jComment
-
Don't know if this adds to the conversation, but when I first saw this chart posted earlier, this is what came to mind?Attached FilesMarcComment
-


Comment