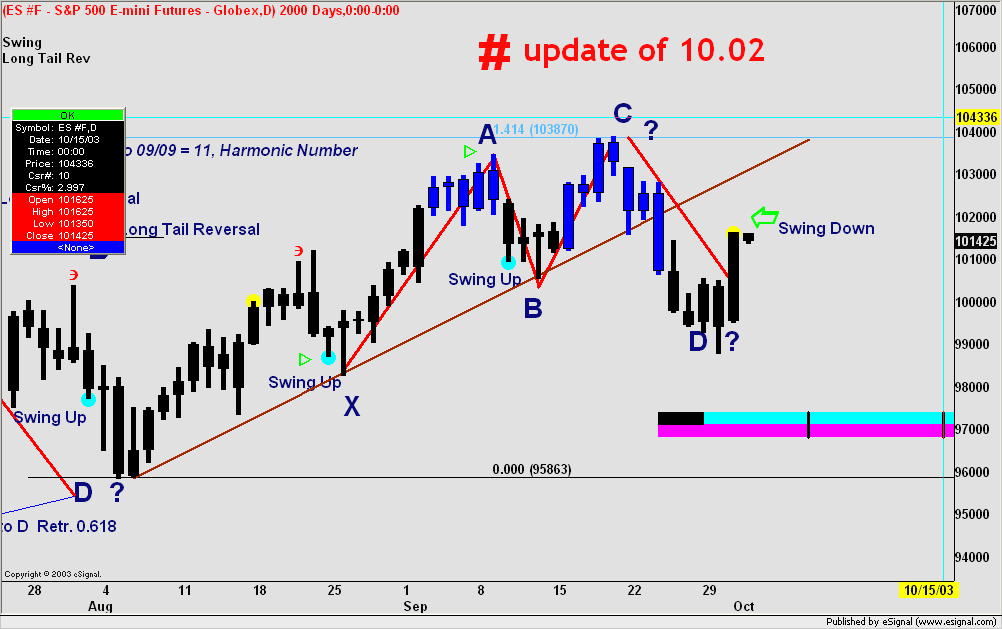
Your projections look good to me and my work. Sept 29 to Oct 3 is a VERY interesting time period . Based on simple squares and square roots I could call a turn Monday morning going up, as I bought 10 ES contracts @ the close Friday .
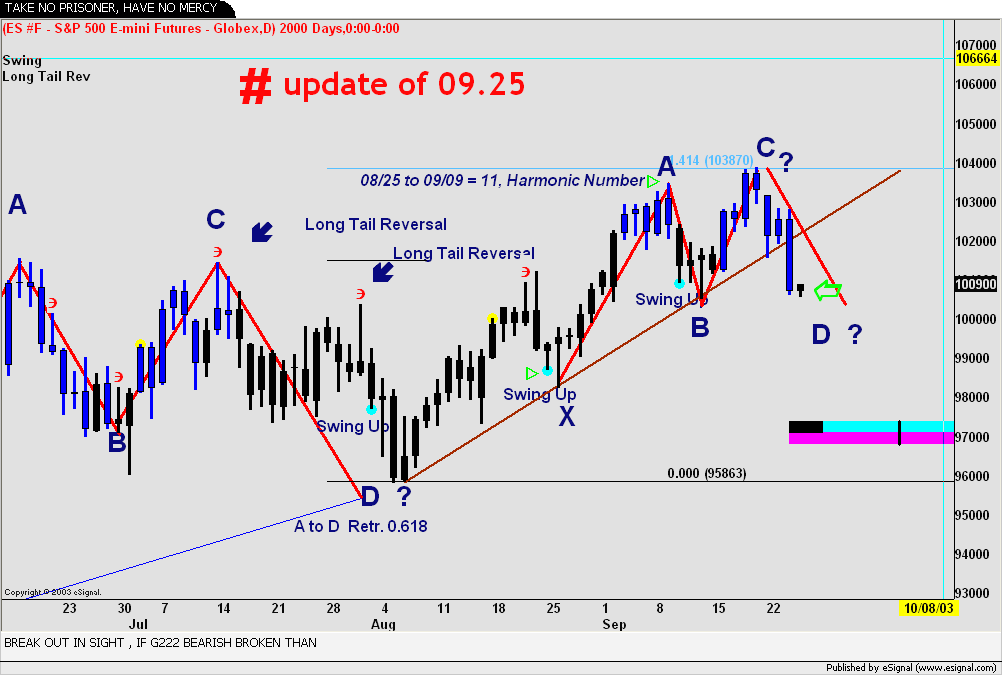
8/26 -9/04= 8 CD 8 rooted is 2.82, add 2 and re-squared you get 23.3 add that to 8/26 and you get Sept 19, the high.
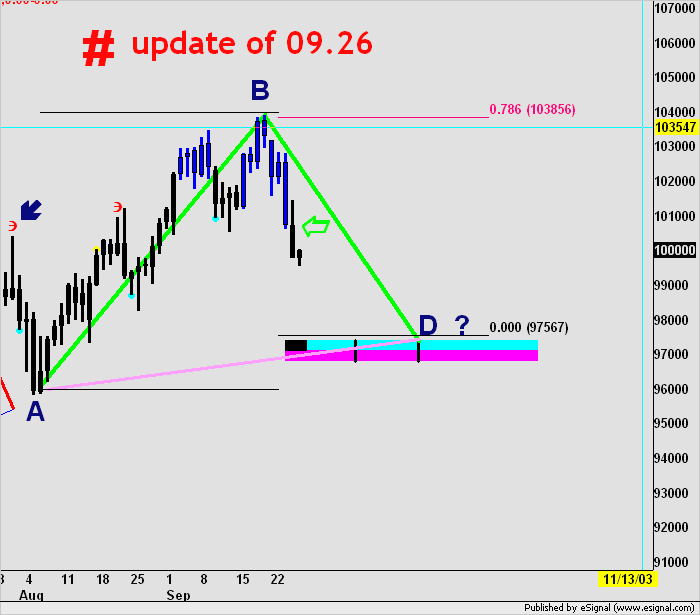
9/09- 9/12= 4 CD 4 rooted is 2 , add 2 and re-square you get 16 add that to Sept 9 and you get Sept 26, last Friday the end of the minor sell off.
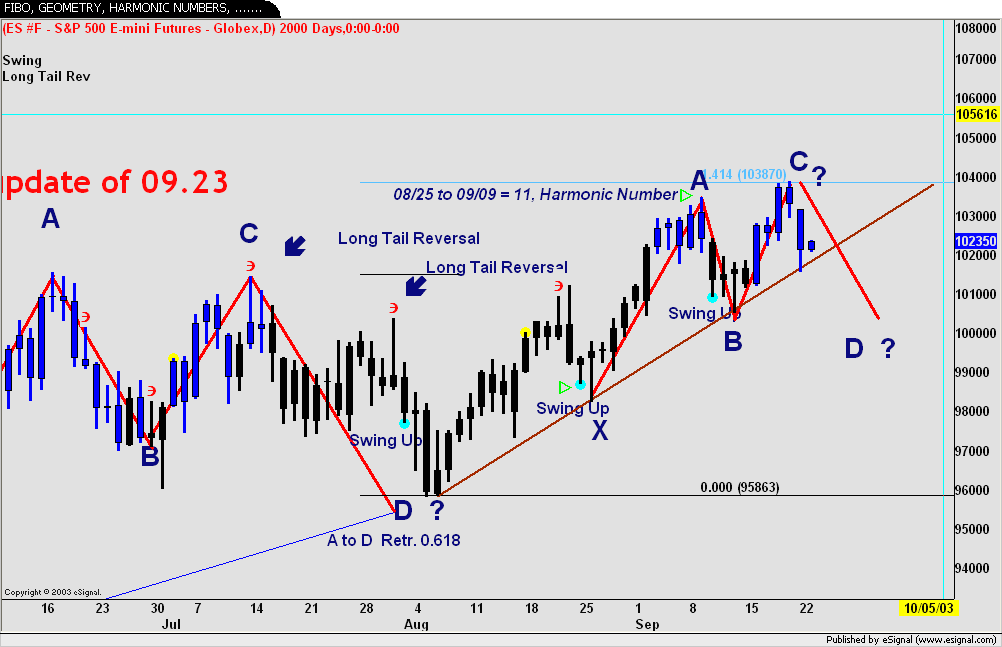
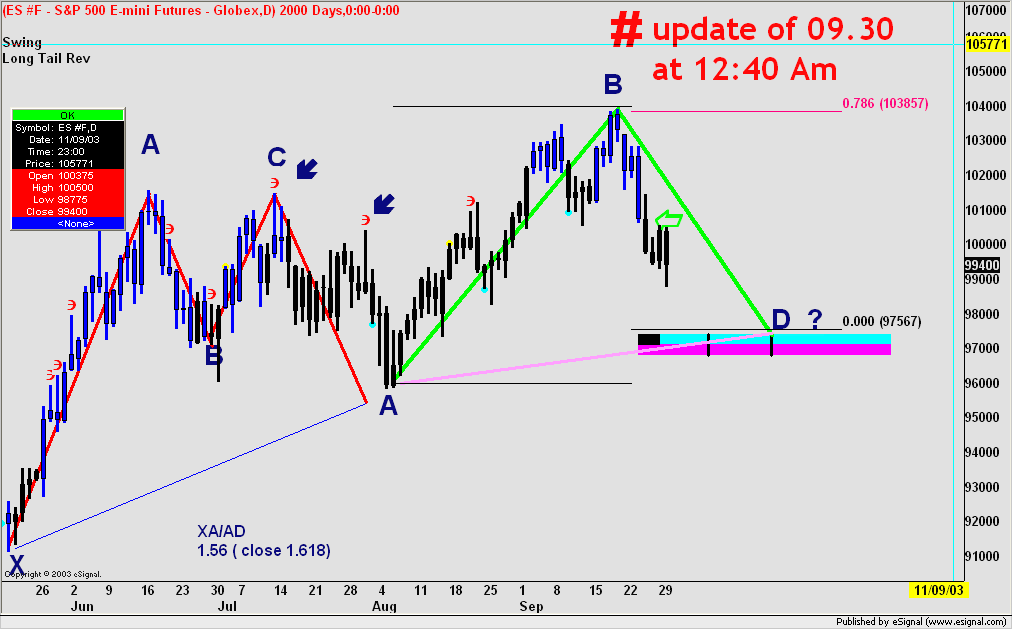
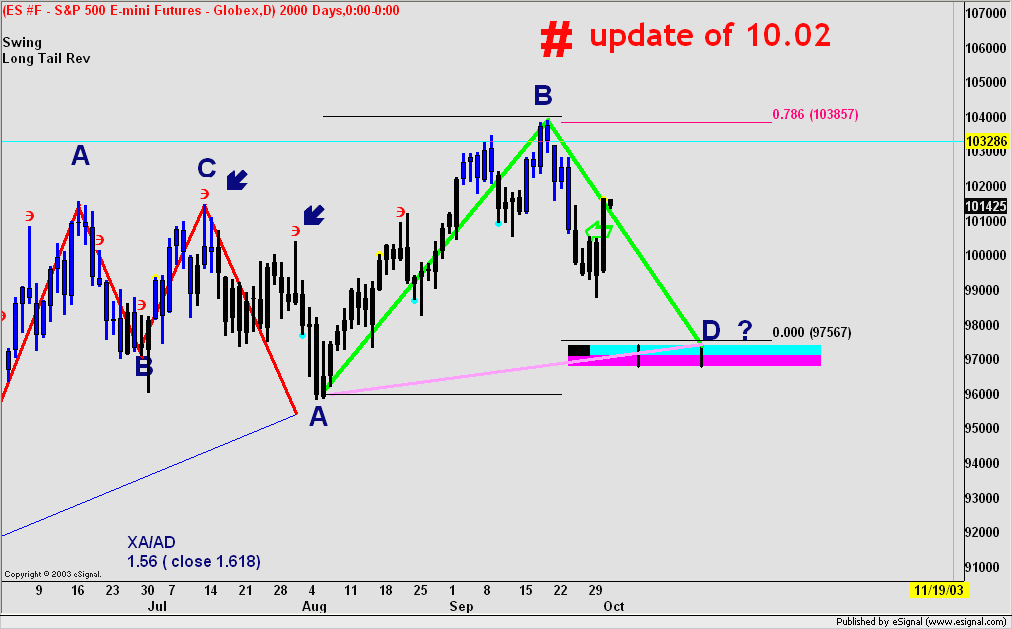
Some more interesting work has to do with Sept 30
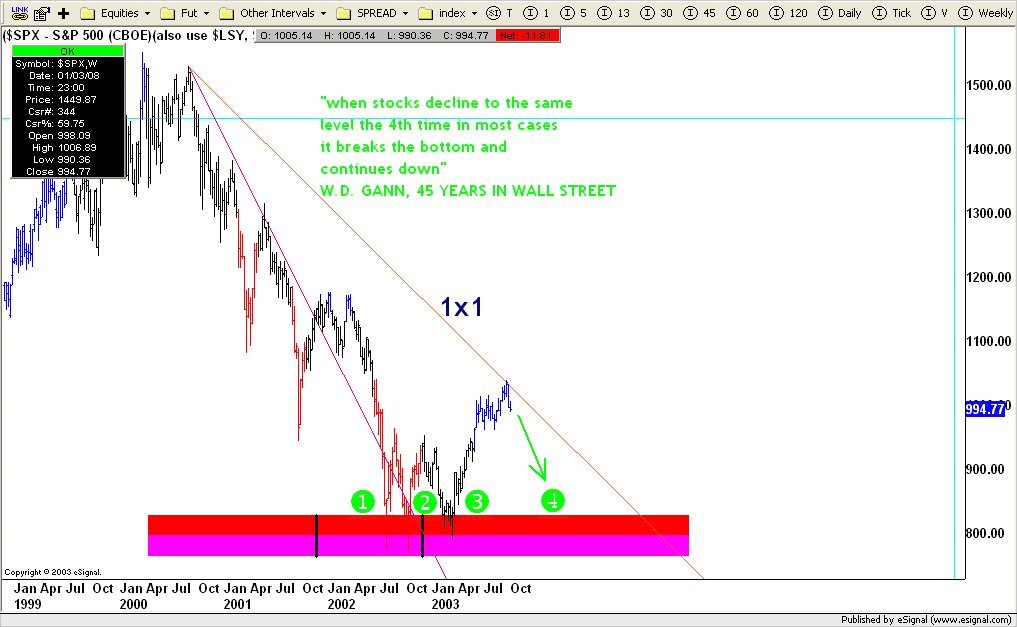
10/10 low to 3/12 low = 153 CD
3/12 low to 8/8 low = 149 CD
8/8 low to 9/30 low = 53 CD
Thanks for the outlook absolutely clear and on which I perfectly mirror myself.
Plumber post your thought more often please;
you have gone well in advance with your studies and I like to read you - as I bekieve many otheres would - and exchange with you.
Something you can trade with also
One more thing, Sept 18 is 49 weeks from Oct 10 2002
The crash of 87 , a total of 5 days, started 49 days after the high
Aug 25 1987. Since Sept 18 2003 the S&P lost 44 points, or a mini crash
Yes but it is very comprehensive in statistics and to make a working model past 3 days is taking me more time than I thought it would. The astrolog program is a good start if set up right to look for astro cycles.
Originally posted by fabrizio Plumber
Impressive ( ehm resize a bit your TS chart....)
By the way did you bought the soft of our two friends one russian living in Russia and the other in NJ?
I should have stated a stop loss price. Based on my square of 9 , if S&P goes below 988 then my cycles are inverted and as such will be stopped out there. If they invert, a cycle low could be Oct 3 and run up into Oct 25. If not then a cycle top could come Oct 3 to at least 1030. The dollar is the key, the only key right now.
Originally posted by theplumber Your projections look good to me and my work. Sept 29 to Oct 3 is a VERY interesting time period . Based on simple squares and square roots I could call a turn Monday morning going up, as I bought 10 ES contracts @ the close Friday .
8/26 -9/04= 8 CD 8 rooted is 2.82, add 2 and re-squared you get 23.3 add that to 8/26 and you get Sept 19, the high.
9/09- 9/12= 4 CD 4 rooted is 2 , add 2 and re-square you get 16 add that to Sept 9 and you get Sept 26, last Friday the end of the minor sell off.
Some more interesting work has to do with Sept 30
10/10 low to 3/12 low = 153 CD
3/12 low to 8/8 low = 149 CD
8/8 low to 9/30 low = 53 CD
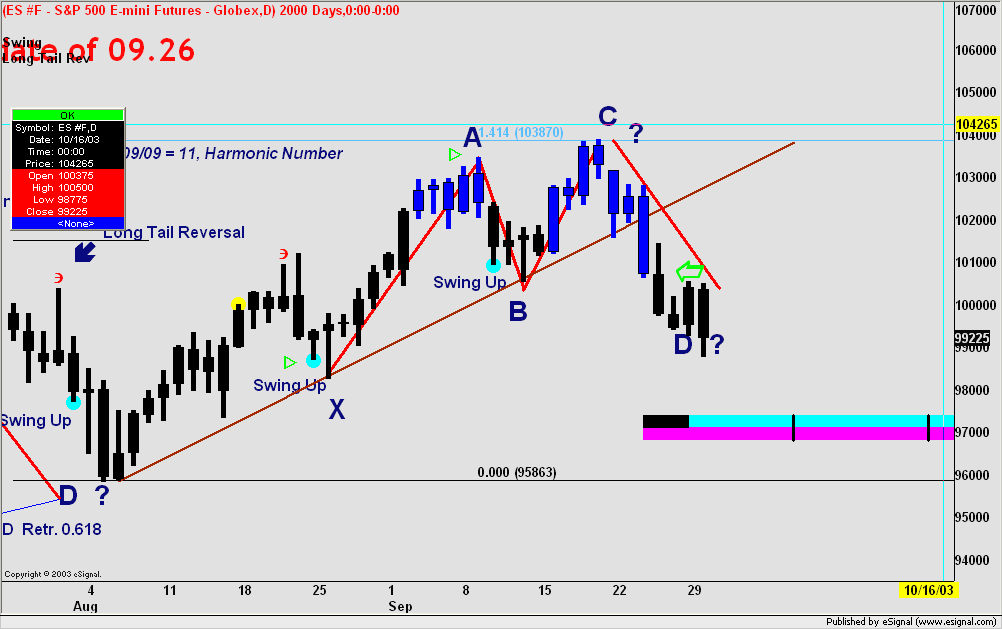
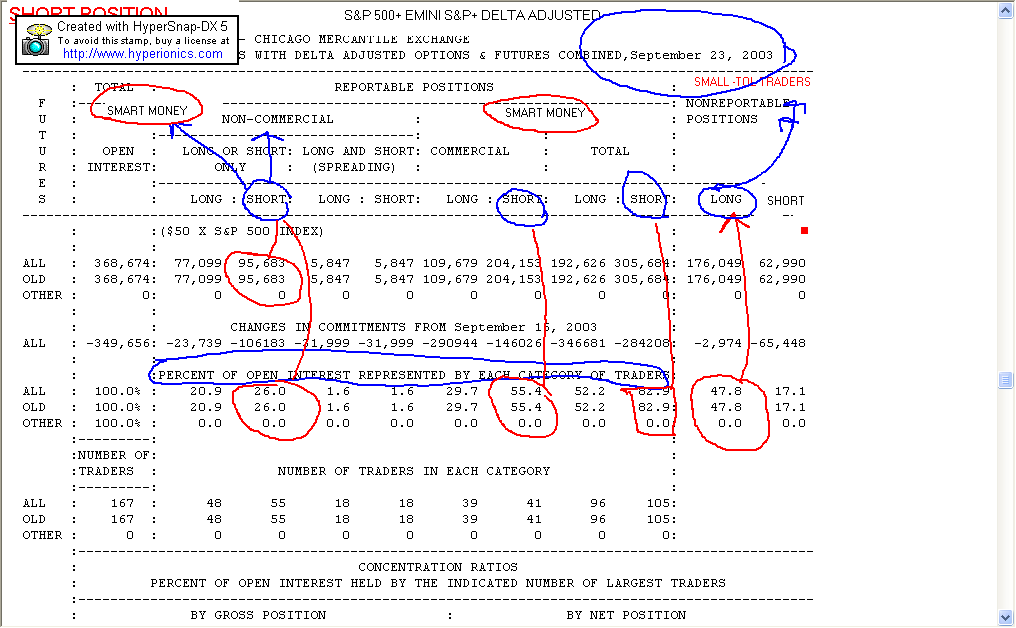
Some Square of 9 stuff. If esignal people read this and wonder how come I don't use their screen capture it's because their file extension png makes too big of a file and this one lets me use gif extension instead. Can I change the file extension for Esignals?
 Tweet
Tweet
Comment