Announcement

Collapse
No announcement yet.

Fibo & Geometry

Collapse
X
 
  • Filter
  • Time
  • Show
Clear All
new posts

  • #46
    cycles

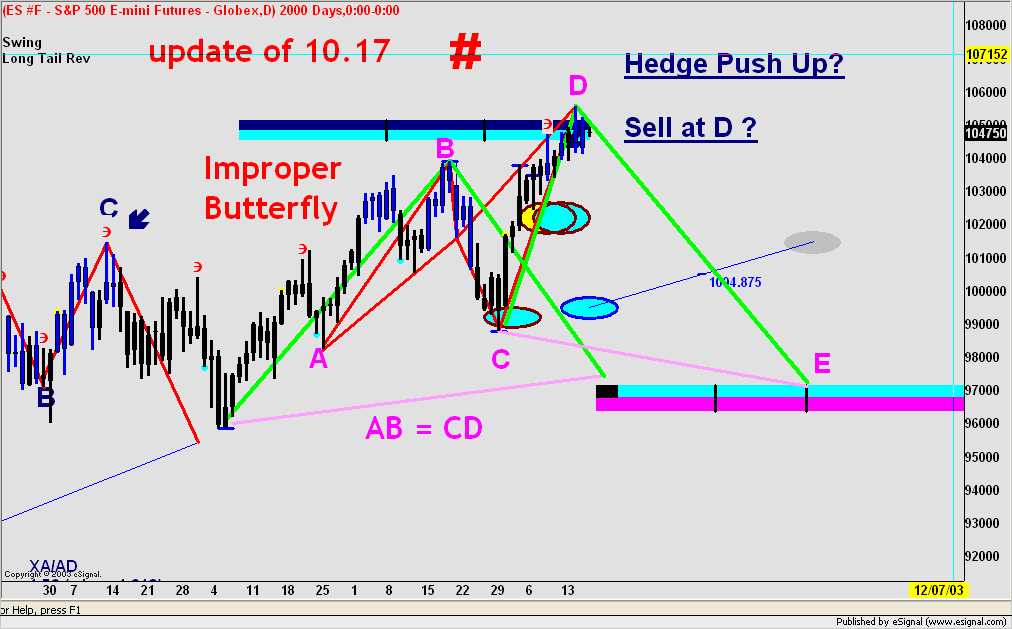
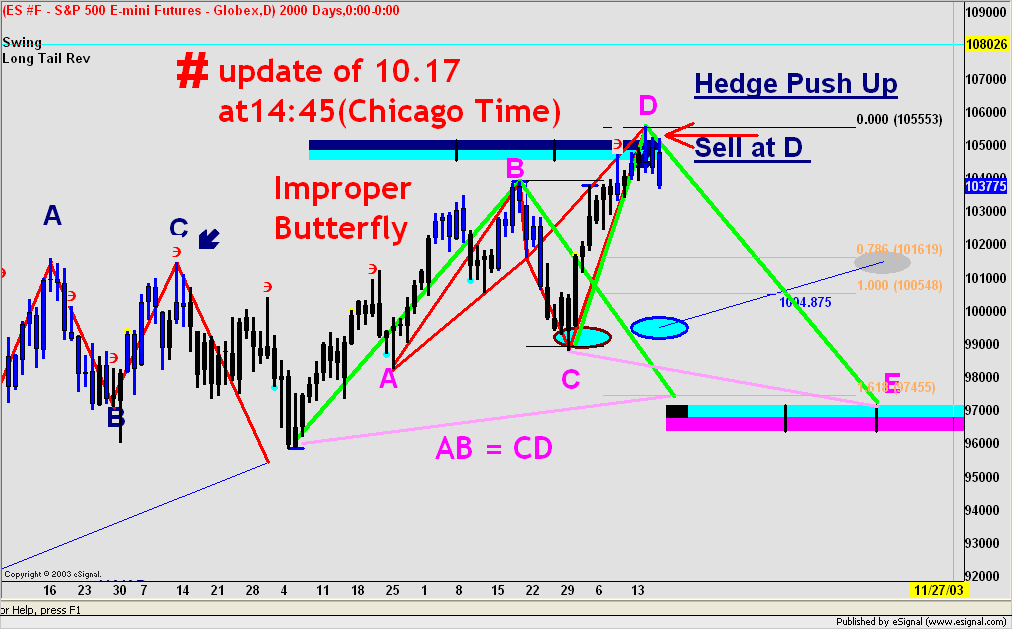
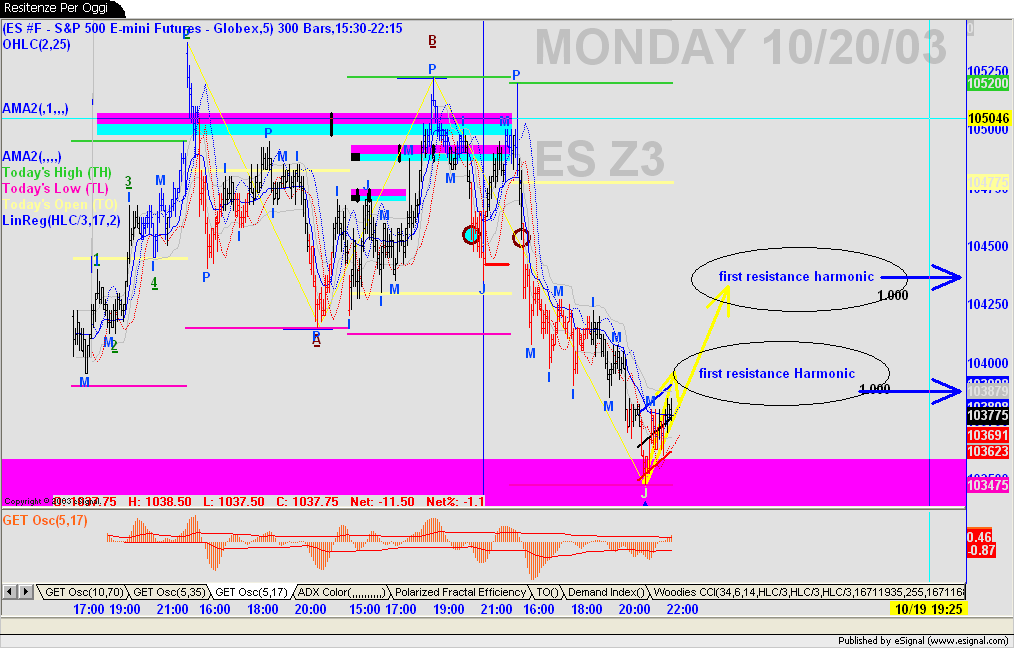
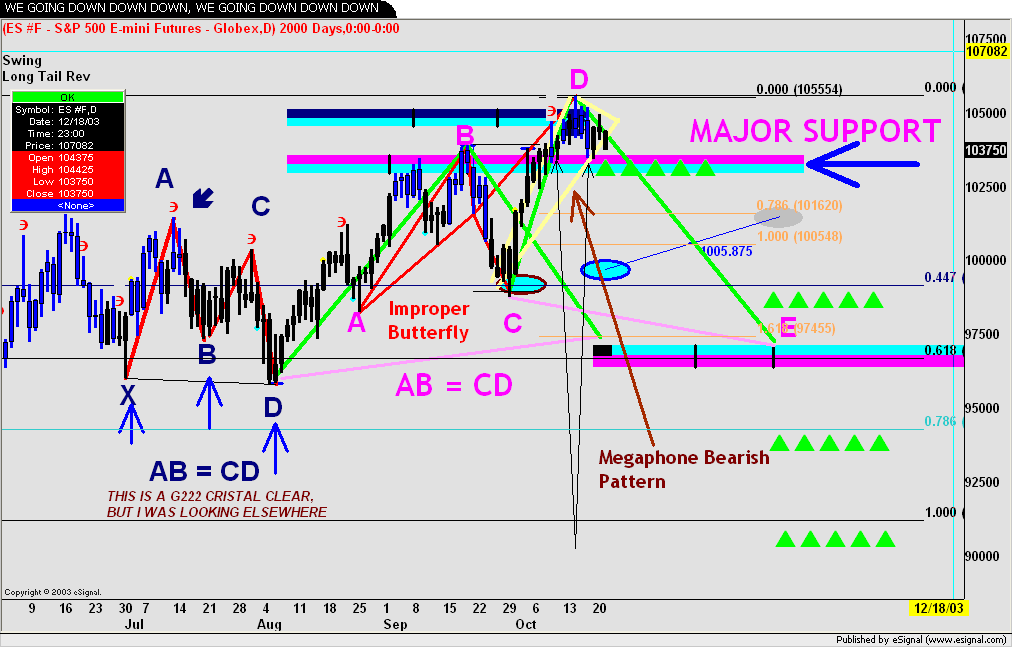
    Was looking at my cycle chart and wondering why a low didn't come, then made this chart. GE is the red line. Now all I see is every message board with top pickers, the top won't happen until everyone is scared to pick it, or short it. A break of 1038 is the live angle, break below and who knows where it goes but chances are the hedgies push to a weekly close above 1050 this week.What I found interesting about today was the MS Cyclical index up as well as MSFT. Traders market
    Attached Files
    Last edited by theplumber; 10-15-2003, 06:32 PM.

    Comment


    • #47
      This is a very basic gartley pattern


      Fabrizio L. Jorio Fili

      Comment


      • #48
        Very basic but quite powerfull


        Fabrizio L. Jorio Fili

        Comment


        • #49
          Square of 9

          Another way to use the square of 9 is for a cyclical day calculator. Look at the dates and a chart to see how it works. The number count is days added to March 24 2000
          Attached Files

          Comment


          • #50
            Just doodling
            Attached Files

            Comment


            • #51
              If this foldback mirror image is to work there should be a rally this week going into Friday Oct 24.
              Attached Files
              Last edited by theplumber; 10-18-2003, 04:54 PM.

              Comment


              • #52
                Just more doodling. My high for this rally is 1152 and the last time a square of price time occured at 25% it hit the Sept lows, and the complete price/time square out was Oct 2002 lows with 768 days from Sept 1 2000 and price of 768. Now it shows 75% as a high on 10/28/2003. We'll see.
                Attached Files

                Comment


                • #53
                  Couple of resistance for today. Obviously Harmonics

                  Fabrizio L. Jorio Fili

                  Comment


                  • #54
                    Some other Harmonics:

                    Max of 8 sept 2000 to min of sept 30 2003 = 1117 days (11 and 17

                    Min of 10 October 2002 to tomorrow 21 october 2003= 54 weeks
                    Fabrizio L. Jorio Fili

                    Comment


                    • #55
                      BULL PARTY IS OVER BELOW 1035/1034

                      Fabrizio L. Jorio Fili

                      Comment


                      • #56
                        Mid day update

                        Fabrizio L. Jorio Fili

                        Comment


                        • #57
                          My up coming trades. May be wrong, may be stopped out but at least have conviction.
                          Attached Files
                          Last edited by theplumber; 10-22-2003, 05:59 PM.

                          Comment


                          • #58
                            Square of 144

                            Another great Gann gem is the square of 144. The first screen is just the simple boxes of 144 in time and price.
                            Attached Files

                            Comment


                            • #59
                              Now add 1X1 2X1 and 1X2 lines to each box as well as divide each box into 3rds with the green lines. Now watch support and resistence from the Oct 2002 lows as well as the command lines of 1X1, 2X1 and 1X2 lines.
                              Attached Files

                              Comment


                              • #60
                                11 week cycle,when it hits chances are it will be a green candle and not a red one.
                                Attached Files

                                Comment

                                Working...
                                X