Announcement

Collapse
No announcement yet.

question for Alex

Collapse
This topic is closed.
X
X
 
  • Filter
  • Time
  • Show
Clear All
new posts

  • Alex
    When I buy a stock
    I want the following three conditions to be true:
    Daily RSI(6) < 20
    30 Minute RSI(6) < 20
    5 Minute RSI(6) < 20


    Is there a way to have "one" daily chart, but only give an alert
    when all three RSI(6)'s are under 20 ?

    Thanks in advance
    Larry Dudash
    HAL at
    http://share.esignal.com/groupconten...r=&groupid=549

    Comment


    • Larry
      I think the best reply on this subject is contained in this post by Garth.
      Alex

      Comment


      • Alex
        (1)Below is efs that allows me to chart my own indicators.
        (2)But it still has one bug.
        (3) When I place in page with 11 charts, only the first chart gets
        the efs, the others are blank.
        (4)Until I use the "reload"
        (5) Is there a way to get around this problem ?


        /***/

        function preMain() {
        // setPriceStudy("true");
        setStudyTitle("03_Les_SEMI_ARRAY");
        setShowCursorLabel("true");
        setStudyMin(0);
        setStudyMax(100);
        setCursorLabelName("SEMI",0);
        setCursorLabelName("ALL",1);
        setDefaultBarStyle(PS_SOLID, 0);
        setDefaultBarStyle(PS_SOLID, 1);
        setDefaultBarFgColor(Color.green, 0);
        setDefaultBarFgColor(Color.maroon, 1);
        setDefaultBarThickness(2, 0);
        setDefaultBarThickness(2, 1);
        setPlotType(PLOTTYPE_LINE, 0);
        setPlotType(PLOTTYPE_LINE, 1);

        }
        var daycount = 0;
        var turnonflag = "false";
        SEMI = new Array(0,17,34,78,92,93,89,92,89,90,87,85,85,53,55, 73,34,14,10,
        19,77,85,85,79,89,91,90,88,88,47,41,72,62,27,19,16 ,21,16,28,73,72,77,86,
        90,84,53,41,14,13,5,2,21,32,13,15,16,63,53,65,81,6 8,78,95,93,87,
        78,94,95,93,96,95,97,84,73,78,89,90,70,43,33,45,26 ,17,11,12,12,10,2,7,57
        ,58,68,81,68,46,72,70,42,15,7,12,18,31,29,64,57,45 ,73,60,14,3,2,2,12,4,5,26,17,15,6,8,22
        ,73,81,93,92,90,92,95,96,90,85,82,82,50,27,6,5,9,5 ,10,18,42,25,17,9,8,2,4,13 );


        function main() {

        addBand(10,PS_SOLID,1,Color.lime,2);
        addBand(80,PS_SOLID,1,Color.red,1);
        var p=0;
        if (getYear() == 2003 &&
        getMonth() == 10 &&
        getDay() == 1
        ) { turnonflag="true";}

        if(turnonflag == "true")
        {daycount = daycount+1;}

        if(turnonflag == "true")
        {p=SEMI[daycount];}


        if(p==0)
        {return;}
        if(p>0)
        {return(p);}

        }
        Larry Dudash
        HAL at
        http://share.esignal.com/groupconten...r=&groupid=549

        Comment


        • Larry
          FWIW I created a Page with 12 charts each one with your efs loaded, then saved the Page and restarted both eSignal and the Data Manager. The Pages all loaded with the efs running without any problems
          Alex

          Comment


          • Alex
            That is interesting.
            I have about 20 pages.
            And in the morning I start at a different page,
            then later on in the day, move to the page with the charts.

            Thanks for your help and info.
            Larry Dudash
            HAL at
            http://share.esignal.com/groupconten...r=&groupid=549

            Comment


            • Alex
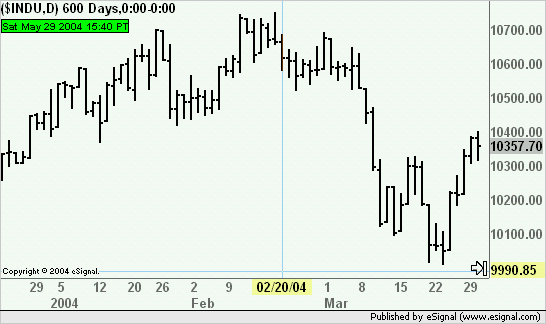
              I post many of my charts to a web site.
              It would be helpful to have date and time automatically
              appear under

              (SMH,30) 2000 Bars,6:30-13:00

              example #1 could be
              5/28/04 11:29 PT

              example #2 could be
              May 28, 2004 11:29 AM PT

              I can program it, but must manually put the data in.
              Can it be done automatically ??
              Larry Dudash
              HAL at
              http://share.esignal.com/groupconten...r=&groupid=549

              Comment


              • Larry
                One way is to use a date object such as in the examples enclosed below which were put together using the EFS Help File.
                Then you can use sDate in drawTextRelative() to write it to the chart
                Alex

                PHP Code:
                var today = new Date();
                var 
                sDate today.toDateString() 
                sDate +="  "+today.getHours();
                sDate +=":"+today.getMinutes();
                sDate +=" PT"

                //this will return Fri May 28 2004  15:18 PT 
                PHP Code:
                var today = new Date();
                var 
                aMonths = new Array("Jan","Feb","Mar","Apr","May","Jun",
                                        
                "Jul","Aug","Sep","Oct","Now","Dec");
                var 
                Month today.getMonth();
                var 
                sDate aMonths[Month];
                sDate +=" "+today.getDate();
                sDate +=", "+today.getFullYear();
                sDate +="  "+today.getHours();
                sDate +=":"+today.getMinutes();
                sDate +=" PT"

                //this will return May 28, 2004  22:28 PT 
                PHP Code:
                var today = new Date();
                var 
                sDate today.getMonth()+1;
                sDate +="/"+today.getDate();
                sDate +="/"+today.getFullYear();
                sDate +="  "+today.getHours();
                sDate +=":"+today.getMinutes();
                sDate +=" PT"

                //this will return  5/28/2004  22:28 PT 

                Comment


                • Alex
                  Here is efs below
                  Question?
                  I do I post it here ?
                  Here is URL to my web site for "test for Alex"

                  http://www.geocities.com/larrydudash2005/index.html
                  .................................................. ...............................
                  /********************************************/
                  function preMain() {
                  setPriceStudy(true); // place bars in upper part of chart

                  }


                  //the above will return Fri May 28 2004 15:18 PT
                  function main() {
                  var today = new Date();
                  var sDate = today.toDateString()
                  sDate +=" "+today.getHours();
                  sDate +=":"+today.getMinutes();
                  sDate +=" PT"
                  //...............Last bar
                  if(isLastBarOnChart())
                  { drawTextRelative(-10,high(0),sDate,Color.black,Color.lime,Text.FRAME |Text.BOTTOM|Text.BOLD,null,9,"buy4");}


                  return;

                  }
                  .................................................. .................................................. ......
                  Larry Dudash
                  HAL at
                  http://share.esignal.com/groupconten...r=&groupid=549

                  Comment


                  • Larry
                    You simply attach it to the message. When you are composing the message scroll down to the Attach File section and click the Browse button.
                    Where do you want the text to appear? I was under the impression that you wanted to place it in the upper left hand corner of the chart. As of now it will print on top of the last bar (starting from 10 bars back).
                    Alex

                    Comment


                    • Alex
                      I quess you do not understand what I am trying to do.
                      (1) I want date to automatically appear in the upper left hand
                      corner of the chart.
                      (2)Do not under stand your comment about attaching some thing to a message. I am not sending a message via email.
                      (3)I am posting chart to web site via Yahoo and want date to
                      appear in upper left hand corner of chart.
                      (4) I do not know how to make appear there automatically.
                      (5) I can make it appear there by changing the first two entries
                      in the command to some thing like (-65,close(0)+25,
                      ...but that is not automatically for each chart.
                      Larry Dudash
                      HAL at
                      http://share.esignal.com/groupconten...r=&groupid=549

                      Comment


                      • Larry
                        The enclosed efs will print the date/time in the upper left corner of all charts
                        Alex


                        PHP Code:
                        function preMain() {
                        setPriceStudy(true); 
                        setShowTitleParameters(false);
                        }

                        function 
                        main() {
                        var 
                        today = new Date();
                        var 
                        sDate today.toDateString() 
                        sDate +=" "+today.getHours();
                        sDate +=":"+today.getMinutes();
                        sDate +=" PT"

                        drawTextRelative(0,20,sDate,Color.black,Color.lime,Text.FRAME|Text.RELATIVETOLEFT|
                                                               
                        Text.RELATIVETOTOP|Text.BOLD,null,9,"buy4");

                        return;

                        Comment


                        • Alex
                          Thanks again for your help
                          The date and time showed up right where I wanted.
                          And I learned a little more about the Esignal Java language

                          about 400 people per week will see your work

                          http://www.geocities.com/larrydudash2005/index.html
                          Larry Dudash
                          HAL at
                          http://share.esignal.com/groupconten...r=&groupid=549

                          Comment


                          • Updating efs with every tic

                            Alex, thanks for your help with my question on conditional plotting. I can see you devoted some time to it.
                            If I could impose on you once again: I'm having problems getting the attached EFS to update with every tic. I've scanned the Bulletin Board and have seen several references to this problem and the solution seems to be two fold. First, to make sure the ComputeOnClose statement is not present. As you can see in my program it is not. Second, that an "if(GetCurrentBarIndex()==0){}" or "if(GetCurrentBarIndex() !=0) {}" is included. I have two questions though. first, SPECIFICALLY where in this EFS should the statement be inserted and where does the second curly bracket go? And second, which of the GetCurrentBarIndex statements is most effective? The one with two equal signs or the one with an exclamation point and an equal sign? Once again, thank you for your help.

                            Michael Helms
                            Last edited by mikejhelms; 06-20-2004, 07:33 PM.

                            Comment


                            • Michael
                              As far as I can see the efs is running in real time. As a confirmation load the attached revision of your efs which now includes a debugPrintln() statement. Open the Formula Output Winow (see under Tools->EFS->Formula Output Window) and run the efs in a chart in Tick Replay. You should see the values in the Formula Output Window updating on every tick.
                              If that is not happening then go to Tools->EFS->Settings and verify that Make all formulas compute on close (rather than tick by tick) is unchecked.

                              With regards to your efs I have made one small modification in Set1 replacing <= with < for both conditions otherwise you have a conflict between Set1 where it is <= and Set2 where it is >=

                              As to the == or != they define two opposing conditions. == means they are equal whereas != means they are not equal.

                              Hope this helps
                              Alex
                              Attached Files

                              Comment


                              • Sorry, I wasn't specific enough

                                Hi Alex. Thank you for spotting the conflict in my program. I've made the adjustments. I should have been more specific though when I said the program wasn't updating with every tic. Try loading the test(debug) you sent me. But before you run it in a tic chart using playback, add a 5 minute simple moving average to the price chart. Then add a price oscillator (short=15, long=40). The condition under which the test(debug) generated plot should dissapear (change to white) is when the slopes of the MA and the oscillator are not both positive or both negative. When this condition is met INTRABAR, the change to white does not occur. It only happens after the bar has finished and the first tic of the new bar occurs. So my question is, Is it possible to have the specified action (change to white) occur when the criteria are met intrabar?

                                Also, attached is a similiar efs which generates two oscillators of differant lengths with program specifications to white out one or the other or both of the generated oscillators when the sign of the slopes of the oscillators and their associated MAs do not match. But in the condition section of the Formula Wizard, specifically in the "then the following will happen every time" function, there seems to be no way to specify which oscillator to white out. All it says it SetBarFgColor. It doesn't offer the option as to which of the generated plots to white out. The result is that all the conditions are applied to the first plot and the second one is never whited out. Is there a way to specify which criteria should act upon which efs generated plot? Thanks again for your help.

                                Michael Helms
                                Last edited by mikejhelms; 06-12-2004, 09:33 PM.

                                Comment

                                Working...
                                X