Announcement

Collapse
No announcement yet.

question for Alex

Collapse
This topic is closed.
X
X
 
  • Filter
  • Time
  • Show
Clear All
new posts

  • #16
    Veda
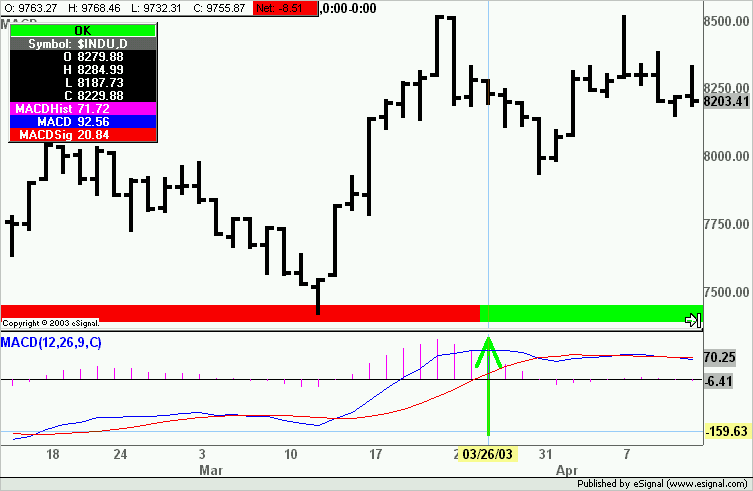
    When painting a plot it can get tricky if you either need to paint more than one plot or the plot you want to paint is not the first one in the Returned Data Points (for example the HIST in the MACD formula I provided).

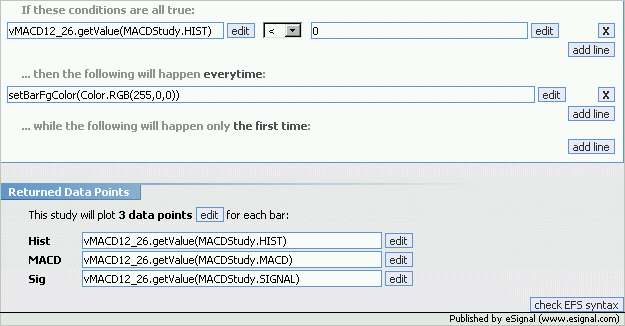
    If you want to paint only one of the plots the easiest solution is to move it to the top of the list of Returned Data Points. This is because by default setBarFgColor() paints the first data return.
    Here then is how the Returned Data Points would look


    If instead you either cannot rearrange the order of Returned Data Points or you need to paint more than one plot then you need to assign setBarFgColor() to the specific plot as shown in the following image.


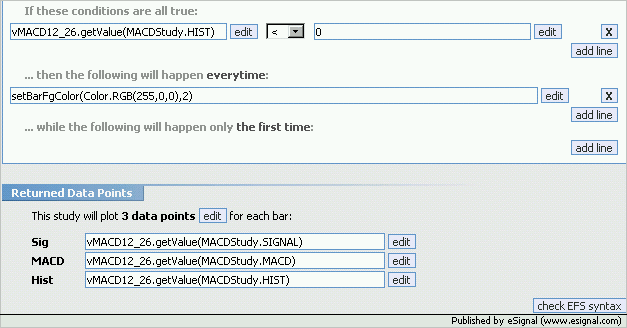
    In this example I left the HIST as the last Returned Data Point but have assigned setBarFgColor() to that plot by adding ,2 in the command line right after the color.
    Now the formula knows that the color is assigned to that specific plot.
    Alex

    Comment


    • #17
      Dear Alex,

      That's terrific - thank you! A refinement I am adding now is that when the MACD Signal line crosses 0 not only does it color the price bar but it alerts me with an alert (for example for charts I may have minimized and am not watching every minute)

      Is there some way of just having an alert pop up once and then I can cancel it and have it not keep popping up? At the moment even when I have an alert set for FIRST TIME ONLY, the program still reads that as Send an Alert on every tick for the FIRST BAR ONLY (which may be a 5 or a 15-minute bar). So I keep deleting the alert but on the next tick it pops back up again because the conditions of FIRST BAR ONLY are still true.

      Does this make sense? I am hoping there is some way to code this so the Alert just pops up once to tell me that the condition is true but then when I have read it and cancelled it, will go away.

      Thanks for any help

      Veda

      Comment


      • #18
        Veda
        Although the Formula Wizard is quite a powerful tool it does have some limitations at this time which need to be complemented by using the Editor.
        The easiest solution to the issue you are describing is to use the setComputeOnClose() command. Open the efs with the Editor and add the line
        setComputeOnClose();
        anywhere in the preMain section.
        This command essentially instructs the efs to calculate only on the close of a bar rather than on every tick. Depending on the individual needs this may or may not represent the ideal solution but it is by far the simplest.
        Try it out and see if it works for you.
        Alex

        Comment


        • #19
          Question for ALEX
          (1) You have helped me before, so I am back again(g)
          (2) The Nasdaq recent lows were 9/30/03 and 8/8/03
          (3) It would be nice to have an "efs" that would draw
          vertical lines at 8/8/03 and 9/30/03
          (4) This would allow me to have a page about the educational
          stocks(There are 6 I follow) and call up vert1.efs that would
          draw two vertical lines(one at 8/8/03 and one at 9/30/03).
          This would allow me to see how these six stocks "lows" compared
          to the Nasdaq Lows.
          (5) I also have page on 7 Home building stocks.
          (6) I would like to edit vert1.efs "directly" to insert the dates
          I want in the future. But right now 8/8/03 and 9/30/03 are
          important.

          Thanks in advance.
          Larry Dudash
          HAL at
          http://share.esignal.com/groupconten...r=&groupid=549

          Comment


          • #20
            Q for L

            What time interval do you follow? Daily? 5 min?

            How many dates would like a vertical line for? 2, max,? 3? 7?

            Comment


            • #21
              Larry
              The attached efs marks the dates you mentioned both on daily or intraday charts.
              It was created with the Formula Wizard which you can use to view and/or edit the parameters. Use the existing conditions as an example to add more dates if needed.
              Alex

              Attached Files

              Comment


              • #22
                Alex
                (1) Not only did you respond very fast.
                (2)But your dates.efs is much better then the vertical lines.
                (3)Why?
                (4)Because your lines DO NOT BLOCK the candle data and the
                Low can clearly be seen.
                (5) Adding your dates.efs to the "default chart" saved me
                drawing 2 lines on 100 charts = 200 lines saved(ggg)

                Thanks again......and I will be back.
                Larry Dudash
                HAL at
                http://share.esignal.com/groupconten...r=&groupid=549

                Comment


                • #23
                  DLooms
                  I guess the best way to answer your question is to give
                  you a URL where I post stock market info
                  (1) Some people have followed me since 1995
                  (2) My info is always FREE
                  (3) The URL connects to my FREE EMAIL List and FREE web site

                  http://www.investorshub.com/boards/b...?board_id=1468


                  PS: IHUB is also FREE(g)
                  Larry Dudash
                  HAL at
                  http://share.esignal.com/groupconten...r=&groupid=549

                  Comment


                  • #24
                    Dear Alex (or Jason or anyone)
                    I am trying to figure out how to mark the chart when the built-in MACD signal line crosses zero. I would like to add a band that changes from red to green every time the signal line crosses zero. But I want the band ON THE CHART not in the indicator window below.
                    Can you show me how I would add the band:
                    1) At the bottom of the chart
                    and
                    2) At the top of the chart

                    Thanks so much for your assistance.

                    Veda

                    Comment


                    • #25
                      Veda
                      The attached should do what you asked
                      All parameters for the MACD can be modified through Edit Studies.
                      Alex

                      Attached Files

                      Comment


                      • #26
                        Hi Alex,

                        I installed your macd~pricestudy and a standard MACD and they do not seem to cross at the same point.

                        Can you post a chart with both studies on it so I can compare what I have with what you have?

                        I check the settings and they are 12,26,9 on both.

                        EZ

                        Comment


                        • #27
                          here is my chart

                          EZ
                          Attached Files

                          Comment


                          • #28
                            Veda
                            Seems to me that when the Signal line is above 0 the bar is green as shown in the enclosed image
                            Alex

                            Comment


                            • #29
                              Dear Alex

                              That's FANTASTIC! Thank you! I see the command you used that I was looking for was the:

                              DrawShapeRelative (.........RELATIVE TO BOTTOM...)

                              On a similar note I notice that when I write code that places a DrawShapeRelative Circle or Square at the default position of the Low of the bar it seems to "crowd" the bar - i.e. it kind of obscures the bottom of the bar visually. Is there a way I can offset the position of the circle down a few pixels from the bottom of the bar so that a small gap is left between the bar's low and the circle?

                              Thanks

                              Veda

                              Comment


                              • #30
                                Veda,


                                Just write low()-1, high()+1, or whatever seperation you want.

                                I can post a simple wizard efs that shows this if you want, just let me know.

                                hope this helps,

                                opstock

                                Comment

                                Working...
                                X