Veda
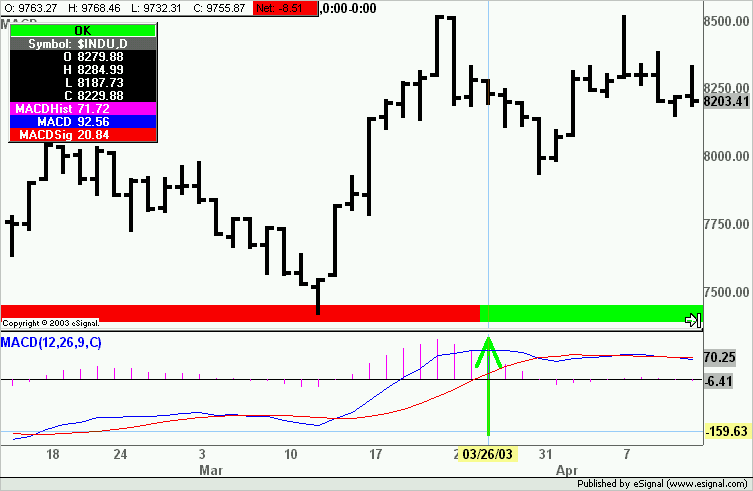
When painting a plot it can get tricky if you either need to paint more than one plot or the plot you want to paint is not the first one in the Returned Data Points (for example the HIST in the MACD formula I provided).
If you want to paint only one of the plots the easiest solution is to move it to the top of the list of Returned Data Points. This is because by default setBarFgColor() paints the first data return.
Here then is how the Returned Data Points would look
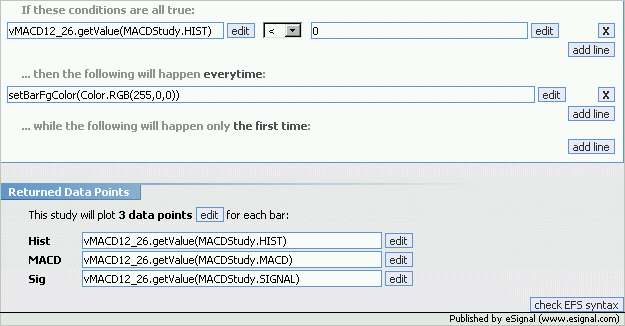
If instead you either cannot rearrange the order of Returned Data Points or you need to paint more than one plot then you need to assign setBarFgColor() to the specific plot as shown in the following image.
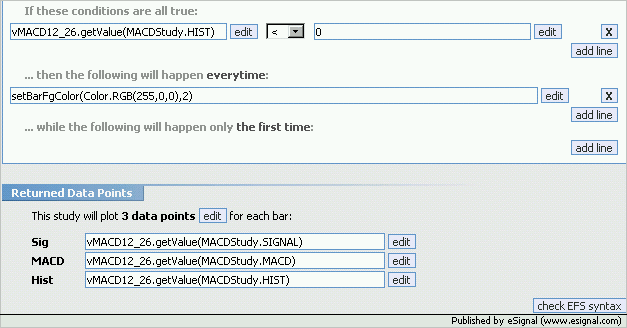
In this example I left the HIST as the last Returned Data Point but have assigned setBarFgColor() to that plot by adding ,2 in the command line right after the color.
Now the formula knows that the color is assigned to that specific plot.
Alex
When painting a plot it can get tricky if you either need to paint more than one plot or the plot you want to paint is not the first one in the Returned Data Points (for example the HIST in the MACD formula I provided).
If you want to paint only one of the plots the easiest solution is to move it to the top of the list of Returned Data Points. This is because by default setBarFgColor() paints the first data return.
Here then is how the Returned Data Points would look

If instead you either cannot rearrange the order of Returned Data Points or you need to paint more than one plot then you need to assign setBarFgColor() to the specific plot as shown in the following image.

In this example I left the HIST as the last Returned Data Point but have assigned setBarFgColor() to that plot by adding ,2 in the command line right after the color.
Now the formula knows that the color is assigned to that specific plot.
Alex

Comment