Announcement

Collapse
No announcement yet.

question for Alex

Collapse
This topic is closed.
X
X
 
  • Filter
  • Time
  • Show
Clear All
new posts

  • #61
    Originally posted by Alexis C. Montenegro
    Larry
    The attached efs should do what you asked.
    The symbol with which the line will appear (default is QQQ) and the value of the line (default is 35.56) can be both modified through Edit Studies.
    To change the color of the line open the efs with the Editor and modify the color value in the addBand line.
    Alex
    Larry Dudash
    HAL at
    http://share.esignal.com/groupconten...r=&groupid=549

    Comment


    • #62
      Alex
      Below is an efs that does not work.
      I am trying to do the following:
      (1) Have a number of dates (only one shown now)
      (2) When a date is hit "want to set VBot= Low for that date)
      AND KEEP THAT NUMBER until the next date is hit.
      (3) Using the closes and THAT LOW ON THAT DATE, calculate
      the percentage gain from that date. Formula shown.
      (4)Why ?
      (5)Because I want to look at the lows in (many stocks)
      since start of 2003 and determine how their percentage gains.
      (6)Why?
      (7) Simple. To pick the best moving stocks.


      /* 0_Percentages using - 6 days ago */


      function preMain() {


      setStudyTitle("Percentages_Using_6 days ago");
      setShowCursorLabel(false);


      }

      function main() {

      var Vc = close();
      if(Vc == null)
      return;


      if (
      getYear() == 2003 &&
      getMonth() == 11 &&
      getDay() == 21)
      { var VBot = low();
      }


      var Vp = ((Vc-VBot)/VBot)*100;

      return Math.floor(Vp);
      }
      Larry Dudash
      HAL at
      http://share.esignal.com/groupconten...r=&groupid=549

      Comment


      • #63
        Larry
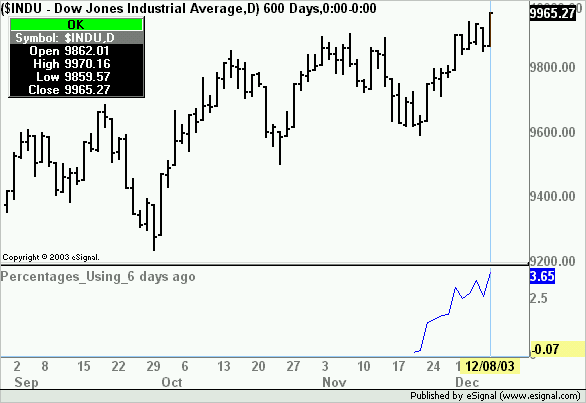
        The enclosed efs is a slight modification of yours and provides the return as in the image below.
        I have also added the option to set the date through Edit Studies.
        Alex


        PHP Code:
        function preMain() {
         
            
        setStudyTitle("Percentages_Using_6 days ago");
            
        setShowCursorLabel(false); 
            
            var 
        fp1 = new FunctionParameter("Year"FunctionParameter.NUMBER);
            
        fp1.setDefault(2003); 
            var 
        fp2 = new FunctionParameter("Month"FunctionParameter.NUMBER);
            
        fp2.setUpperLimit(12);
            
        fp2.setLowerLimit(1);
            
        fp2.setDefault(11); 
            var 
        fp3 = new FunctionParameter("Day"FunctionParameter.NUMBER);
            
        fp3.setUpperLimit(31);
            
        fp3.setLowerLimit(1);
            
        fp3.setDefault(20);    

        }

        var 
        VBot=0;
        var 
        vFlag=0;

        function 
        main(Year,Month,Day) {

        var 
        Vc close();

            if(
        Vc == null)
            return;
            
            if(
        getYear()==Year && getMonth()==Month && getDay()==Day){  
                
        vFlag=1
                VBot 
        low();
            }
             
        var 
        Vp = ((Vc-VBot)/VBot)*100;
            
            if(
        vFlag!=1)
            return;
               
            return 
        Vp;

        Comment


        • #64
          Alex
          Thanks for the efs.

          And more thanks for showing me how to use
          the new functionparameter.
          It makes the coding so simple.

          Larry Dudash
          Larry Dudash
          HAL at
          http://share.esignal.com/groupconten...r=&groupid=549

          Comment


          • #65
            Hi Alex,

            I wonder if I could get your help with a variation on an MACDcolorhist formula you tweaked for me before? (See below about 7 posts and attached efs)

            I have been trying to create a new formula to do the following - but it seems to be beyond the capabilities of Formula Wizard, possibly because in this formula we have both compute on each tick and compute on close...

            I am trying to create a script that will pull up an MACD (12, 26,9) and do the following:

            1) Have the histograms colored up or down, eg blue for current LAST above the previous histogram CLOSE, red for LAST below previous histogram CLOSE. This is to be computed for the current bar as we are going along, not at end of bar i.e. not setComputeOnClose.

            2) Have a play-sound-alert-ding for end of bar only, if this histogram CLOSES above previous histogram CLOSE or below previous histogram CLOSE (in other words I don't want it to 'ding' throughout the current bar, only at END of bar if condition is met)

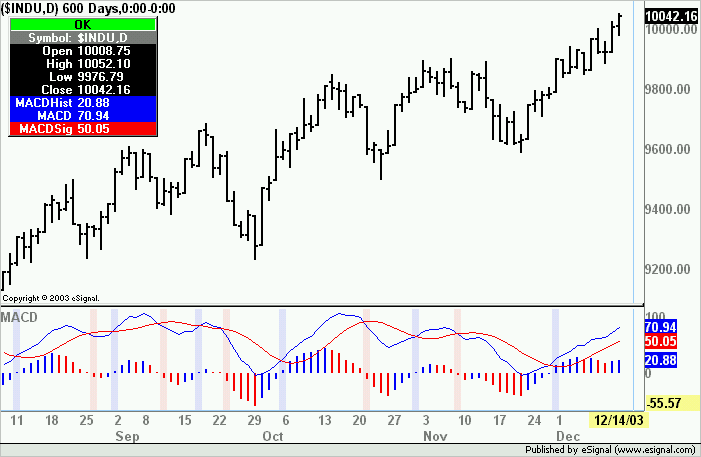
            3) Draw a pale colored background bar in indicator window (for example setBarBgColor(Color.RGB(230,230,255)); ) if the histogram has crossed zero upwards or crossed zero downwards. Now with this one I would like the option of making it either current bar as it is happening OR at END of bar only. Is that possible? If not I would prefer it in real time rather than end-of-bar.

            4) I don't need the alert box BUY/SELL or the UpArrowDownArrow as in the attached efs.

            Thanks for any help you can give me on this!

            Best wishes, Veda
            Attached Files

            Comment


            • #66
              Veda
              The attached efs should do what you asked.
              Rather than using the efs you mentioned I just created it using the new builtin MACD that is available as of version 7.5.
              The efs will
              1) Color the histogram in real time in blue if the value is higher than the prior and red if lower.
              2) Color the background in real time in pale blue when the histogram crosses above the 0 line and pale red when crosses below.
              3) Sound an alert on bar close only. If the bar closes above the prior one it will sound a blip otherwise it will sound a ding.
              Hope this helps
              Alex

              Attached Files

              Comment


              • #67
                Alex
                Can I create one XYZ.efs file, but place a few small separate
                programs in it.

                Example
                Create XYZ.efs

                (1) Have a Premain()
                then a Main()
                (2) Leave some space or lines or what ever
                Have anothe Premain()
                Another Main()
                (3)Leave some more spave or lines or what ever
                Have another Premain()
                Another Main()

                etc
                etc

                Thanks inadvance
                Larry Dudash
                HAL at
                http://share.esignal.com/groupconten...r=&groupid=549

                Comment


                • #68
                  Re: Reply to post 'question for Alex'

                  no, only one premain and main per efs

                  >

                  Comment


                  • #69
                    Larry
                    To add to David's reply, if the object of what you are trying to do is combine several studies/indicators (or the related signals) then you may be able to code them in the same efs or code them separately and use call() or callFunction() to retrieve those signals.
                    Alex

                    Comment


                    • #70
                      Dear Alex,

                      Yes that's terrific - thank you!

                      One last tweak is needed as I realize what I actually need is the alert sound to play not just if the histogram closed higher or lower than the previous histogram, but if the histogram closed Blue when the previous histogram was Red and vice versa. i.e. to play an alert sound when the histogram changes color

                      Is that possible?

                      Thanks very much

                      Veda

                      Comment


                      • #71
                        3/10 day moving average crossover

                        Dear Alex: I hope you can help me. I have been trying for several days to program and looking for a formula and the closest I found was under the E-Signal library. Needless to say, at this point I am getting frustrated . Here is the link - http://www.esignalcentral.com/univer.../efs_database/
                        If you then look under the EFS Library folder then the Help Examples folder, you will see the “ Bt Moving Average” formula.You will see the Back-Testing Moving Average with Buy/Sell boxes, arrows and smiley faces whenever a signal is generated.

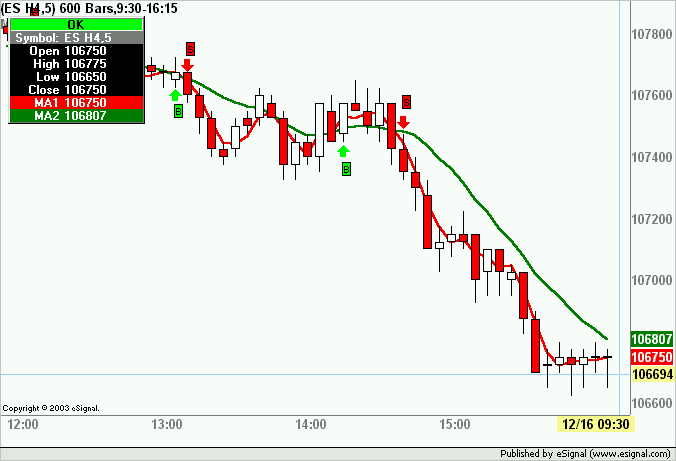
                        I have also attached a chart of the 1 minute ES H4 candlestick chart with a 3(red line) & 10(green line) day moving average, no offsets and volume weighted for today 12/15/2003.

                        Here is what I would like to do with the chart below:

                        At 13:16 p.m. EST when the 3 day moving average crosses below the 10 day moving average, I would like a sell signal box and a down arrow to appear (no smiley face)
                        Conversely at 13:36 when the 3 day moving average crosses above the 10 day moving average, I would like a buy signal box and an up arrow to appear (no smiley face)
                        Is there also a way to have a sound file blare off to alert me.
                        Obviously, I would like this file to overlay on the candlestick price chart.

                        The difference is, I would like E-Signal to generate the buy/sell signals when the 3 day MA crosses the 10 day MA not when the MA crosses the price bars. I hope you can lead me in the right direction and if it is too complicated, I would like your recommendation on what EFS Partner would be best to program this.

                        I appreciate all your help Alex as you have helped me on a small matter before and hope you can help me out here. Thank you !!!

                        Sincerely,
                        Paul W.
                        Attached Files

                        Comment


                        • #72
                          Veda
                          The attached revision of the efs plays a sound only on change of color of the histogram.
                          Alex
                          Attached Files

                          Comment


                          • #73
                            Paul
                            The attached efs should do what you asked.
                            It uses the crossovers of 2 MAs (default lengths 3 and 10) to trigger the trading signals, plot Buy/Sell boxes and Up/Down arrows and play a sound.
                            All parameters for both MAs can be modified using Edit Studies.
                            Alex

                            Attached Files

                            Comment


                            • #74
                              MACD Crossover

                              Dear Alex:
                              Thank you very much for your reply. Alex, your great !! The download works perfectly and I even played around with the programming in the EFS Editor and revised some of the items in the program. I am still along way off from being an expert programmer as yourself. I have one more favor to ask of you, please !!

                              I would like to do the same thing on the MACD chart below like you did on the moving average program you sent me. Basically, on the first MACD chart below I have shown the settings that I use. The second MACD chart below, I think I can handle on my own once you send me the programming for the first MACD chart.

                              I would like the chart to issue a sell signal arrow, sell signal box and an audio alert when the MACD line (red line) crosses below the signal line (green line), which occurred below at 14:48 p.m. EST

                              I would like the chart to issue a buy signal arrow, buy signal box and an audio alert when the MACD line crosses above the signal line, which occurred below at 15:16 p.m. EST.
                              I would like this program to use my existing chart so it will overlay on top of the MACD chart.
                              Alex, I found an example of this in the EFS Library, but it sets up a brand new chart and as I mentioned above I would like for it to overlay on my existing chart.

                              Alex, I hope I am not being a pain in the #$^^%$&&, but this is a great thing that E-Signal has done with these bulletin boards. Else I would be looking for another Charting Platform. Again, I hope this is not asking too much. Also could you suggest where I could begin in learning how to do this programming? Does E-Signal offer classes or seminars on programming charts?

                              Thanks again, Alex, for all your help and have a great holiday season !!

                              Sincerely,
                              Paul W.

                              Comment


                              • #75
                                MACD Crossover

                                Alex: Heres the chart
                                Attached Files

                                Comment

                                Working...
                                X