Announcement

Collapse
No announcement yet.

question for Alex

Collapse
This topic is closed.
X
X
 
  • Filter
  • Time
  • Show
Clear All
new posts

  • #46
    Hi again,

    Alex, or anyone else, I awoke last night in a dream about this study. Not very healthy, I admit, but realized that what I do is create several studies of the same type with different look back periods. I have seen in many of Alex's studies that he sets up a complete set of variable inputs that can be changed in the "edit studies" section of eSignal.

    My request is for some assistance in making the look back period a variable so I can only retain one study instead of many to change the look back period.

    Your assistance is appreciated.

    EZ
    Attached Files

    Comment


    • #47
      EZ
      I had already done that. Here is the efs with editable lookback (default is 150)
      Alex
      Attached Files

      Comment


      • #48
        sorry Alex. I had your original one with a fixed look back.

        Thanks,

        EZ

        Comment


        • #49
          EZ
          What I actually meant to say was "I had that already done" ie ready to be posted because I had already implemented that change.
          My apologies for having explained myself poorly.
          Alex
          Last edited by ACM; 10-17-2003, 06:49 PM.

          Comment


          • #50
            Hi Alex,

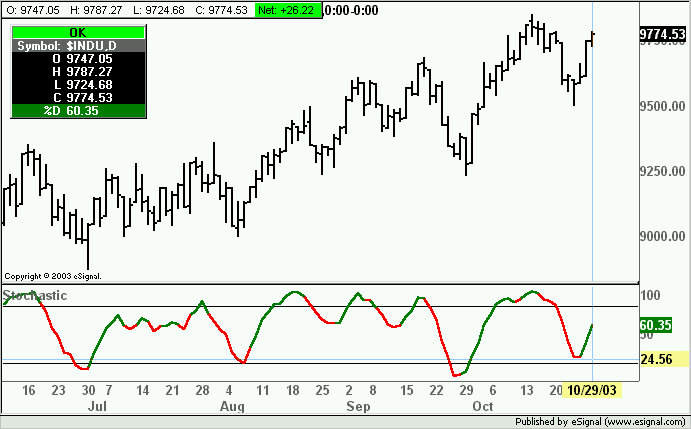
            I am trying to program a 7,3,3, Stochastic but only show the %D line and have it change color from green to red every time it changes direction from up to down and vice versa.

            I cannot seem to do it satisfactorily. Can you help?

            Thanks for your time

            Veda

            Comment


            • #51
              Veda
              The attached efs should do what you asked. All you need to do is set the values to 7,3,3 using Edit Studies
              Alex

              Attached Files

              Comment


              • #52
                Dear Alex,

                The attached file is taken from the Formulas/Other folder and is designed to have MACD histogram bars change color depending on whether they are going up or down relative to the previous bar's histogram.

                However it doesn'tquite work as it should. What happens is that it changes color based on whether the current tick is above or below the previous tick, as you'll see if you watch it in action. So at the end of a 5-min bar the histogram may show the wrong color and you have to reload it to get it to redraw itself to the right color relative to the previous bar.

                Now an obvious solution is to add setComputeOnClose but is there a way you can adjust it so it actually works tick by tick , not just bar by bar?

                Thanks in advance for your time and skill.

                Veda
                Attached Files

                Comment


                • #53
                  Re: question for Alex

                  Originally posted by ez2njoy
                  Question for Alex.

                  What does the thermometer.efs do.

                  I am curious.

                  Also, thanks for all of your work on compiling the variable efs list that you put together.

                  Ez2njoy
                  Larry Dudash
                  HAL at
                  http://share.esignal.com/groupconten...r=&groupid=549

                  Comment


                  • #54
                    Question for Alex

                    (1)Can an efs be written that would only show up for one stock?
                    (2)Example: a horizontal line(where I would entry 35.56) for
                    a stock like QQQ
                    (3)Why?
                    (4)Because I use this same one minute chart for many stocks
                    by clicking their sysbols.
                    (5)But only want the 35.56 horizontal line to show up on QQQ

                    Thnak in advance......again
                    Larry Dudash
                    HAL at
                    http://share.esignal.com/groupconten...r=&groupid=549

                    Comment


                    • #55
                      Larry
                      Not sure if you are asking about thermometer.efs or not.
                      If yes click here for a full description.
                      Alex

                      Comment


                      • #56
                        Larry
                        The attached efs should do what you asked.
                        The symbol with which the line will appear (default is QQQ) and the value of the line (default is 35.56) can be both modified through Edit Studies.
                        To change the color of the line open the efs with the Editor and modify the color value in the addBand line.
                        Alex
                        Attached Files

                        Comment


                        • #57
                          Alex
                          Very good !

                          Hey! Take a look at my web site where I tried 5 times to draw
                          that horizontal line.

                          It shows "clearly" how much BETTER your efs works !!!

                          Thanks again

                          Larry Dudash
                          HAL at
                          http://share.esignal.com/groupconten...r=&groupid=549

                          Comment


                          • #58
                            Veda
                            I believe the attached fixes the histogram color issue.
                            It does not however deal with the multiple intrabar alerts. To limit those without resorting to setComputeOnClose() you would need to separate the alerts from the current condition and place them in a condition of their own in a
                            if(getBartState()==BARSTATE_NEWBAR){
                            your alert conditions
                            your alert commands
                            }
                            This way the histogram color would continue to paint in real time but the alerts would be issued only when a new bar is plotted.
                            Hope this helps
                            Alex
                            Attached Files

                            Comment


                            • #59
                              Alex

                              That's terrific. Thank you so much

                              Veda

                              Comment


                              • #60
                                Originally posted by Alexis C. Montenegro
                                Larry
                                The attached efs should do what you asked.
                                The symbol with which the line will appear (default is QQQ) and the value of the line (default is 35.56) can be both modified through Edit Studies.
                                To change the color of the line open the efs with the Editor and modify the color value in the addBand line.
                                Alex
                                Larry Dudash
                                HAL at
                                http://share.esignal.com/groupconten...r=&groupid=549

                                Comment

                                Working...
                                X