Announcement

Collapse
No announcement yet.

Some simple EFS2 scripts

Collapse
This topic is closed.
X
X
 
  • Filter
  • Time
  • Show
Clear All
new posts

  • Some simple EFS2 scripts

    It is often requested that eSignal provide an =2 symbol for AB, YM and some other futures so that users can compute Pivots or other studies based only on the daily Highs and Lows of the RTH session. The main reason for the request is that in EFS1 it is not always an easy task to create these studies without the overnight data and although there are some solutions available - such as for example in this thread - they still have limitations.
    With EFS2 instead the task becomes relatively easy thanks to its ability to handle multiple intervals. Here is one way to solve the problem.

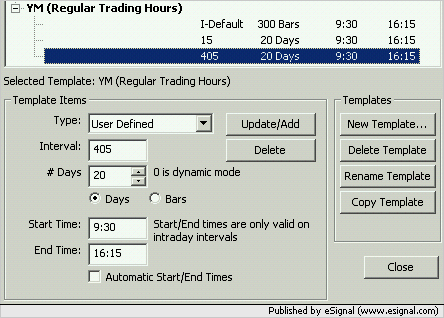
    As a first step add a User Defined 405 minute Interval to the Time Template you are using and set the Start/End times to 9:30/16:15 or equivalent if in a time zone different from Eastern (see example in the following image).


    Then run the following efs

    PHP Code:
    function preMain() {

        
    setPriceStudy(true);
        
    setStudyTitle("Pivot Points");
        
    setCursorLabelName("PP-R2"0);
        
    setCursorLabelName("PP-R1"1);
        
    setCursorLabelName("PP"2);
        
    setCursorLabelName("PP-S1"3);
        
    setCursorLabelName("PP-S2"4);
    }

    var 
    vPP null;
    var 
    vR1 null;
    var 
    vS1 null;
    var 
    vR2 null;
    var 
    vS2 null;  

    function 
    main() {

        var 
    vHigh  high(-1,inv("405"));
        var 
    vLow   low(-1,inv("405"));
        var 
    vClose close(-1,inv("D")); 
        
        if (
    vHigh==null||vLow==null||vClose==null) return;
        
        
    vPP = (vHigh+vLow+vClose)/3;
        
    vR1 2*vPP-vLow;
        
    vS1 2*vPP-vHigh;
        
    vR2 = (vPP-vS1)+vR1;
        
    vS2 vPP-(vR1-vS1);

        return new Array(
    vR2vR1vPPvS1vS2);

    You can immediately see how much more compact the code is respect to the EFS1 equivalent which by the way also needs an auxiliary efs (you can find the original scripts in the Pivots and OHLC subfolders of Formulas).

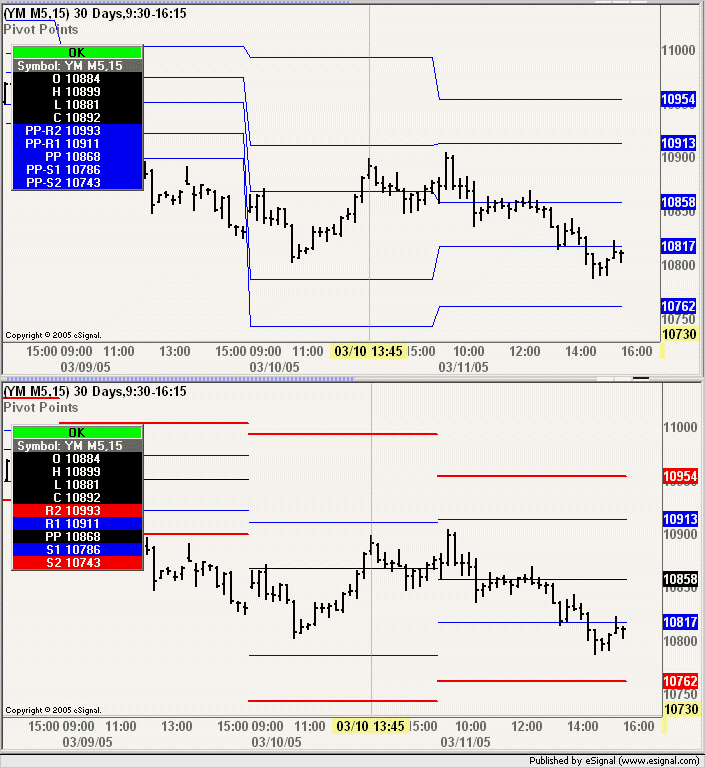
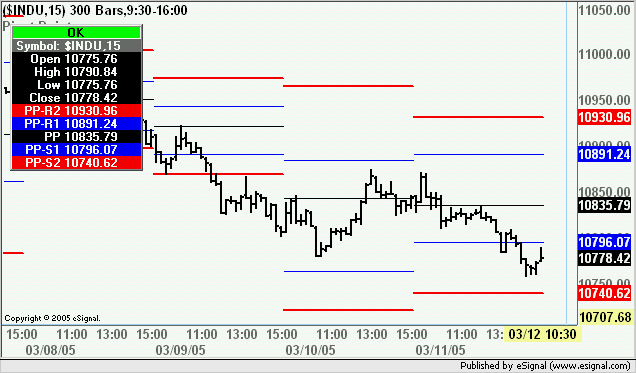
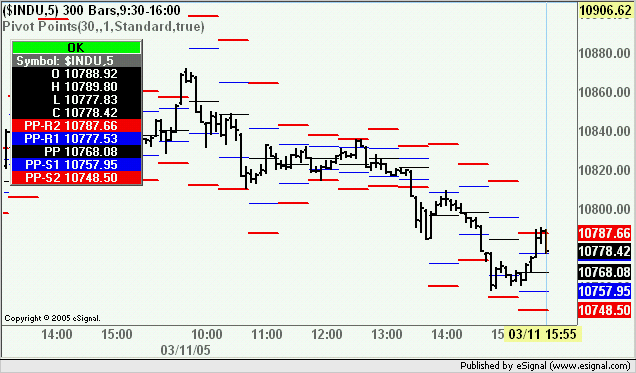
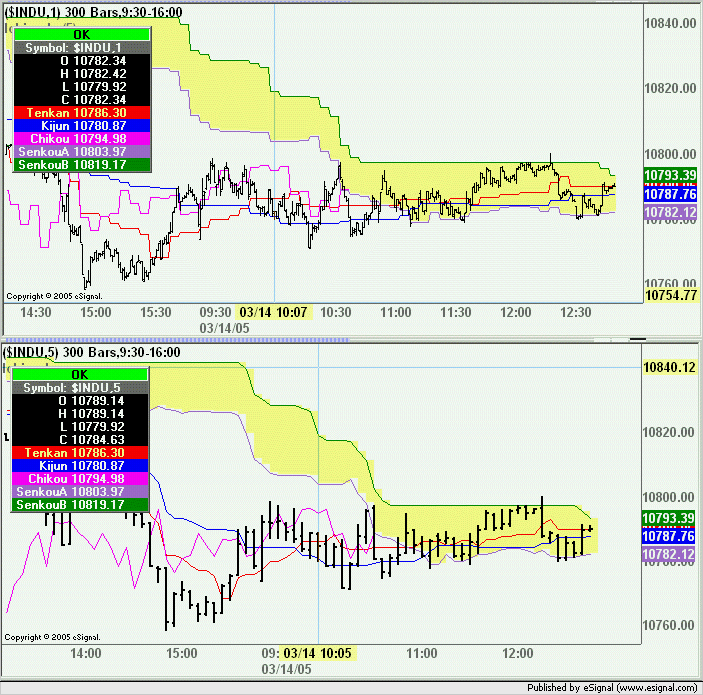
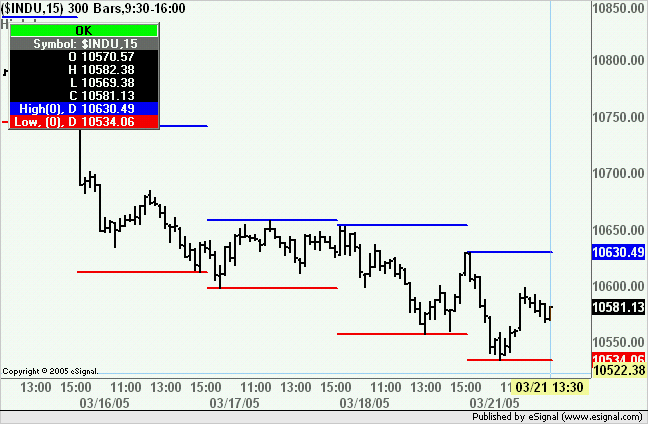
    In the following image the Pivots in the top chart are based on the efs enclosed in this post while in the bottom chart they are based on the efs mentioned earlier
    As you can see the Pivots are now based on RTH i.e. the High and Low of the 405 minute interval and the daily Close even though YM does not have an =2 symbol.
    Notice also how thanks to the new formula engine the solution is within everyone's reach from a programming standpoint.


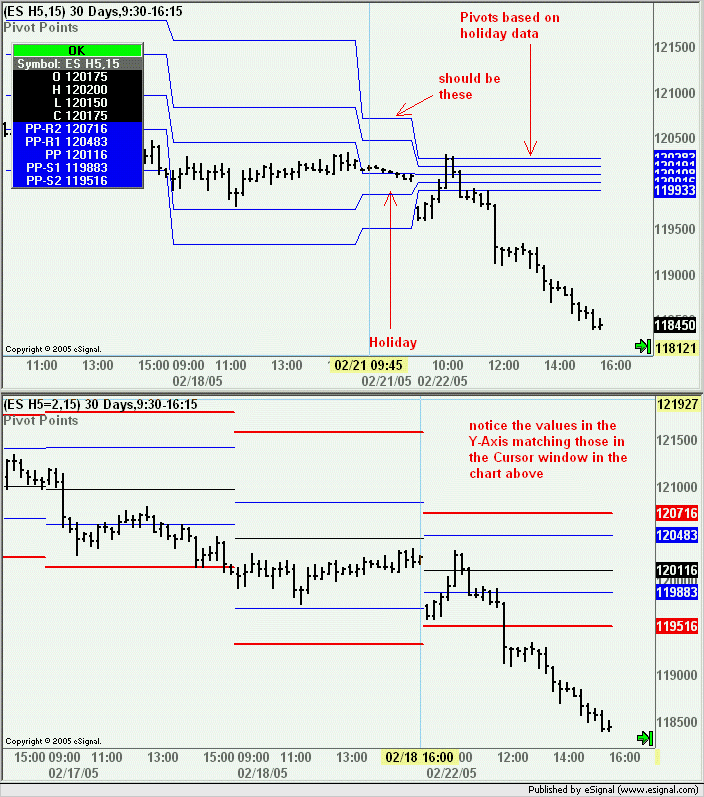
    At this point having resolved one issue we still face the other problem created by the lack of an =2 symbol and that is the fact that Globex keeps on trading on certain holidays (which the =2 symbols skip) thereby returning incorrect values for High, Low, Pivots, etc.
    Once again EFS2 makes it extremely easy for us to resolve this.

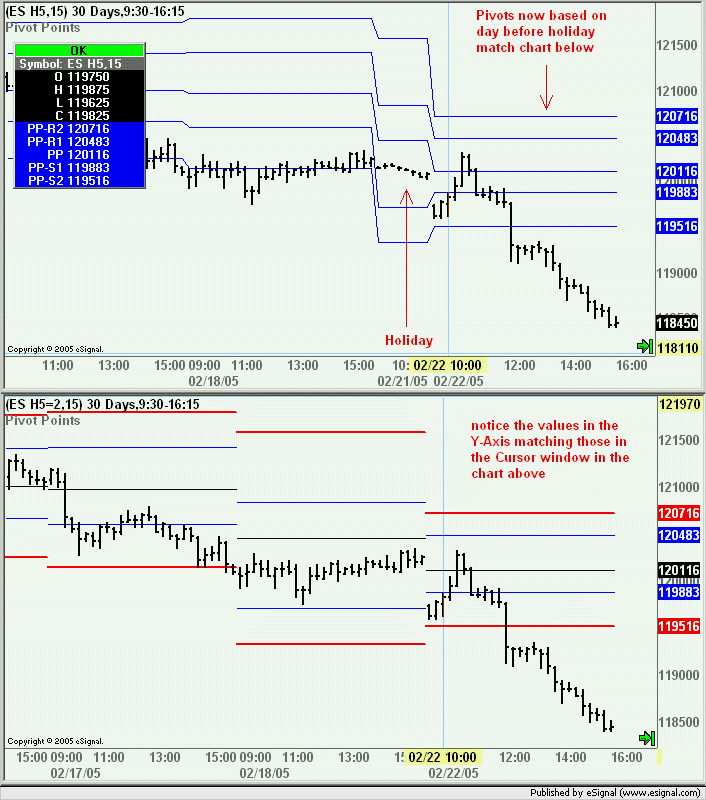
    On the day that follows a holiday replace the -1 in the values of high(), low() and close() with -2. This means that instead of calculating the Pivots based on the prior day which had incomplete data we will be calculating them on the day before that which is what we would be doing if the holiday data did not exist.

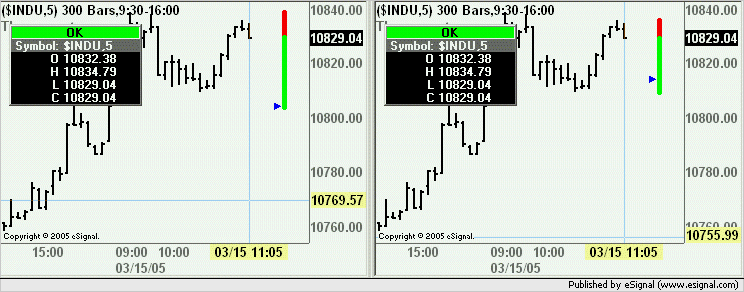
    To illustrate this situation I am using the charts of ES H5 and ES H5=2 on the day following Febrruary 21nd which was a holiday. Notice that in the top chart (i.e. ES H5) the Pivots on February 22nd are different from those of the bottom chart (i.e. ES H5=2).


    However once I modify the script to compute the Pivots based on the data from two days before they are now the same. Here is the section of the code I am modifying...

    PHP Code:
    var vHigh  high(-2,inv("405"));
    var 
    vLow   low(-2,inv("405"));
    var 
    vClose close(-2,inv("D")); 
    ...with the following result


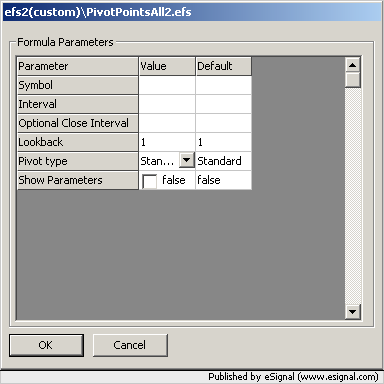
    In the next message I will be posting a fully customizable version of the Pivot study

  • #2
    PivotPointsAll2

    The attached efs computes the Pivot Points based on user defined intervals. It can also be used in an intraday chart to plot Pivots based on a different intraday time frame. The top chart in the following image is a 15 min chart with Pivots based on daily data while the bottom chart is a 5 min chart with pivots based on the 30 min interval.


    User defined parameters are the following
    Symbol - The symbol on which to base the Pivots. Default is the chart's symbol.
    Interval - The interval on which to base the Pivots. By default if the chart is intraday the Pivots are based on the daily bar, if the chart is daily they are based on the weekly bar and if weekly they are based on monthly
    Optional Close Interval - This is used when the Close needs to be based on an interval that is different from the one specified above. See the prior message in this thread for an example. By default it uses the same interval as the main one.
    Lookback - Allows to base the calculations for the Pivots on a bar other than the prior one. See previous message for an example of when this could be used. Default is the prior bar.
    Pivot Type - Can be Standard, DeMark or Woodie. Default is Standard.
    Params - Switches on (true) or off (false) the display of the parameters in the chart. Default is false.


    Copy [or updated version] of this efs is also available here
    Attached Files

    Comment


    • #3
      Thermometer2

      The attached efs is the EFS2 version of a script I posted a while back that replicates the "Thermometer" found in the Quote Board.
      The separation line between the red and green areas indicates the Last, the green area the Low-to-Last and the red area the High-to-Last. A blue triangle indicates the Open.
      By default if the chart is intraday it will display the daily Thermometer, if daily it will display the weekly and if weekly it will display the monthly. It can also be used to display the "temperature" of any user defined interval for the current or past bars. The left chart shown below draws the daily Thermometer on a 5 min chart while the one on the right shows the 60 min Thermometer plotted on the same 5 min chart
      User defined parameters are the following
      Interval - This sets the interval on which the Thermometer is based
      Lookback - The bar whose "temperature" we want to read (0 is current bar, 1 is prior bar, 2 is two bars ago, etc)
      Params - Switches on (true) or off (false) the display of the parameters in the chart. Default is false.
      To run this study you need eSignal version 7.9 Beta 1 or later.
      Alex


      Copy [or updated version] of this efs is also available here
      Attached Files

      Comment


      • #4
        Ichimoku2

        Attached is the EFS2 revision of another script I posted some time ago i.e. the Ichimoku study. This release includes the option to plot the study across multiple intervals.
        In the top chart of the following image you can see that the study is based on a 5 minute interval while being plotted on a 1 minute chart. The bottom chart is the same study plotted on the 5 minute chart for comparison purposes.
        For more information on the efsInternal() function used in this script see this thread
        To run this study you need eSignal version 7.9 Beta 1 or later.
        Alex

        Edit: The original Ichimoku2 study had an issue with efsInternal() not updating the plot of the Chikou line (ie the Close offset backwards) and has now been replaced. At this time if the interval on which the efs is based is the same as that of the chart the Chikou line will update its plot in real time. If instead the interval is different from that of the chart it will compute the historical values correctly but it will not update the plot in real time. Once the negative offset on external interval problem is resolved I will replace the version currently posted.


        Copy [or updated version] of this efs is also available here
        Attached Files

        Comment


        • #5
          amStudies Library

          The amStudies Library is now posted here
          Download and save the file to the FunctionLibrary folder in the eSignal directory.
          Currently included in the amStudies Function Library are the following studies: DEMA, KAMA, LSMA, Sine Weighted MA, T3 MA, TEMA and Triangular MA.
          Syntax and examples are provided in the amStudies HTML document available at the same link.
          All the studies included in the amStudies Library can be used with any other eSignal or custom function that accepts a series, Also all the studies can be used with multiple intervals or different symbols like the builtin eSignal studies. Sample scripts for each study are available here
          To use the amStudies Library and these studies you need eSignal version 7.9 Beta 1 or later.
          Alex

          Comment


          • #6
            LSMA

            Enclosed below is the basic version of an efs that will compute the Least Squares MA
            A fully customizable version of the efs (enabled for use with multiple symbols/intervals) is available here
            To run this study you need eSignal version 7.9 Beta 1 or later and the amStudies Library (see this post in this thread}
            Alex

            PHP Code:
            function preMain() {

                
            setPriceStudy(true);
                
            setStudyTitle("LSMA");
                
            setCursorLabelName("LSMA",0);
                
            setDefaultBarFgColor(Color.blue,0);
            }

            var 
            amLib addLibrary("amStudies.efsLib");
            var 
            study null;

            function 
            main() {

                if(
            study==nullstudy amLib.amLSMA(10);

                return 
            study.getValue(0);

            Comment


            • #7
              KAMA

              Enclosed below is the basic version of an efs that will compute the KAMA
              A fully customizable version of the efs (enabled for use with multiple symbols/intervals) is available here
              To run this study you need eSignal version 7.9 Beta 1 or later and the amStudies Library (see this post in this thread)
              Alex

              PHP Code:
              function preMain() {

                  
              setPriceStudy(true);
                  
              setStudyTitle("KAMA");
                  
              setCursorLabelName("KAMA",0);
                  
              setDefaultBarFgColor(Color.blue,0);
              }

              var 
              amLib addLibrary("amStudies.efsLib");
              var 
              study null;

              function 
              main() {

                  if(
              study==nullstudy amLib.amKAMA(10,2,30);

                  return 
              study.getValue(0);

              Comment


              • #8
                T3 MA

                Enclosed below is the basic version of an efs that will compute the T3 Moving Average
                A fully customizable version of the efs (enabled for use with multiple symbols/intervals) is available here
                To run this study you need eSignal version 7.9 Beta 1 or later and the amStudies Library (see this post in this thread)
                Alex

                PHP Code:
                function preMain() {

                    
                setPriceStudy(true);
                    
                setStudyTitle("T3 MA");
                    
                setCursorLabelName("T3 MA",0);
                    
                setDefaultBarFgColor(Color.blue,0);
                }

                var 
                amLib addLibrary("amStudies.efsLib");
                var 
                study null;

                function 
                main() {

                    if(
                study==nullstudy amLib.amT3(6,0.7);

                    return 
                study.getValue(0);

                Comment


                • #9
                  High-Low

                  The attached efs will plot the High and Low of any interval for the selected Lookback. By default if the chart is intraday it will plot the current day's High/Low, if the chart is daily then it will plot the current week's High/Low and if weekly the current month's values.
                  The Cursor Label will indicate which Lookback bar and Interval are selected for the Highs and Lows. For example High(0), D is the High for the current daily bar, Low(1), 60 is the Low of the prior bar on a 60 minute interval.
                  User defined parameters are the following
                  Interval - This sets the interval of the High/Low
                  Lookback - This option allows to select from which bar of the user defined interval we want to plot the High/Low (0 is current bar, 1 is prior bar, 2 is two bars ago, etc)
                  Color High - Allows selection for the color of the High plot
                  Color Low - Allows color selection for the Low plot.
                  Params - Switches on (true) or off (false) the display of the parameters in the chart. Default is false.
                  To run this study you need eSignal version 7.9 Beta 1 or later.
                  Alex


                  Copy [or updated version] of this efs is also available here
                  Attached Files

                  Comment


                  • #10
                    Session High-Low

                    The attached efs is a variation of the one first posted here.
                    As in the original script this efs computes the daily High and Low using only the intraday data plotted in the chart. The main difference is that this script will calculate the High and Low over the entire 24 hour period beginning from the session's start time which can be modified in Edit Studies (set to 16:30 by default).
                    Another difference is that the plots of the session's High and Low can be back adjusted across all the historical bars within the session (by default the script is set to display non back adjusted plots but you can change this in Edit Studies by setting Adjust to true).
                    Lastly this efs can be used also on issues that do not trade overnight (however if you do want to plot the High and Low of only the overnight session then you need to use the original script.)
                    Other user defined parameters include the options to color the plots and to display/hide the parameters in the study's title.
                    Note that this efs is intended for use only with intraday data.
                    Alex
                    Attached Files

                    Comment


                    • #11
                      Time Series Forecast

                      The Time Series Forecast study has now been added to the amStudies Library which is posted here (see prior message regarding the Library).
                      As with all the other studies included in the amStudies Library the Time Series Forecast can be used with any other eSignal or custom function that accepts a series, Also it can be used with multiple intervals or different symbols like the builtin eSignal studies.
                      Syntax and examples are provided in the amStudies HTML document available at the same link.
                      To run this or the other studies in the Library you need eSignal version 7.9 Beta 1 or later.
                      Alex

                      Note: This version of the Time Series Forecast is similar to that used in TradeStation. Metastock instead computes the Time Series Forecast in a slightly different way and a study that replicates that version will be also added to the library.

                      Comment


                      • #12
                        Enclosed in the following PHP box is a basic version of the Time Series Forecast set up as a price study and using the default source ie Close

                        PHP Code:
                        function preMain() {

                            
                        setPriceStudy(true);
                            
                        setStudyTitle("TSF");
                            
                        setCursorLabelName("TSF",0);
                            
                        setDefaultBarFgColor(Color.blue,0);
                        }

                        var 
                        amLib addLibrary("amStudies.efsLib");
                        var 
                        study null;

                        function 
                        main() {

                            if(
                        study==nullstudy amLib.amTSF(10,5);

                            return 
                        study.getValue(0);

                        Enclosed below instead is an example of how the Time Series Forecast can be used as a study on study (in this case the CCI)
                        Fully customizable versions of both these EFSs (enabled for use with multiple intervals/symbol) are available here
                        Alex

                        PHP Code:
                        function preMain() {

                            
                        setPriceStudy(false);
                            
                        setStudyTitle("TSF_CCI");
                            
                        setCursorLabelName("TSF",0);
                            
                        setDefaultBarFgColor(Color.blue,0);
                            
                        addBand(80,PS_SOLID,1,Color.black);
                            
                        addBand(-80,PS_SOLID,1,Color.black);
                        }

                        var 
                        amLib addLibrary("amStudies.efsLib");
                        var 
                        study null;

                        function 
                        main() {

                            if(
                        study==nullstudy amLib.amTSF(6,3,cci(10,hlc3()));

                            return 
                        study.getValue(0);

                        Comment


                        • #13
                          Time Series Forecast (Metastock version)

                          The Metastock version of the Time Series Forecast study has now been added to the amStudies Library which is posted here (see prior message regarding the Library).
                          As with all the other studies included in the amStudies Library the Time Series Forecast can be used with any other eSignal or custom function that accepts a series, Also it can be used with multiple intervals or different symbols like the builtin eSignal studies.
                          Syntax and examples are provided in the amStudies HTML document available at the same link.
                          Also available at the same link is the xml file that allows these studies to be listed in the Formula Editor Toolbox
                          To run this or the other studies in the Library you need eSignal version 7.9 Beta 1 or later.
                          Alex

                          Comment


                          • #14
                            Price Oscillator

                            A Price Oscillator is now included in the amStudies.efsLib available here
                            This Price Oscillator is different from the builtin version. That version computes the oscillator as a ratio using the equation ((fastMA-slowMA)/fastMA)*100 whereas the one included in the amStudies simply calculates the difference between the two averages and returns the value as price. You can see the difference in the returned values of the two Oscillators in the image shown below.
                            Enclosed is the basic version of an efs that will plot the Oscillator. A fully customizable version of the same efs (enabled for use with multiple symbols/intervals) is available here
                            To run this study you need eSignal version 7.9 Beta 1 or later and the amStudies Library (see prior message in this thread)
                            Alex

                            PHP Code:
                            function preMain() {

                                
                            setPriceStudy(false);
                                
                            setStudyTitle("Oscillator");
                                
                            setCursorLabelName("Osc",0);
                                
                            setDefaultBarFgColor(Color.blue,0);
                                
                            setPlotType(PLOTTYPE_HISTOGRAM,0);
                                
                            setDefaultBarThickness(1,0);
                            }

                            var 
                            amLib addLibrary("amOscillator.efsLib");
                            var 
                            study null;

                            function 
                            main() {

                                if(
                            study==nullstudy amLib.amOsc(10,21,0);

                                return 
                            study.getValue(0);

                            Comment


                            • #15
                              Standard Deviation Envelope

                              The attached formula is the EFS2 version of the StdevEnvelope2.efs posted in this thread and is now enabled for use with multiple intervals. The image below shows the efs running on a daily chart but computing the envelope on the weekly data.
                              Interesting side note is that this efs is considerably more efficient to run than the prior EFS1 version even though it is performing much more complex tasks.
                              eSignal version 7.9 is required to run this efs.
                              Copy [or updated version] of the efs is also available here
                              Alex

                              Attached Files

                              Comment

                              Working...
                              X