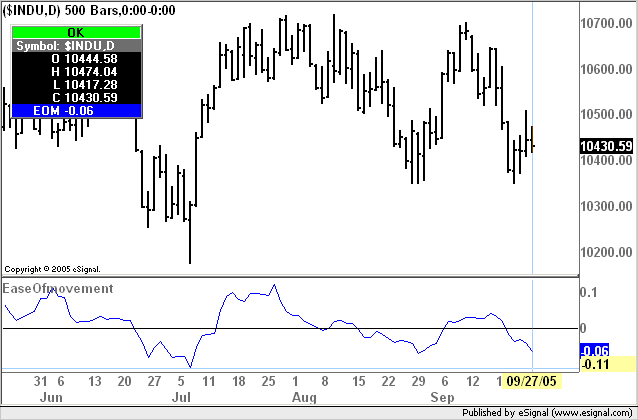
Announcement

Collapse
No announcement yet.

Some simple EFS2 scripts

Collapse
This topic is closed.
X
X
 
  • Filter
  • Time
  • Show
Clear All
new posts

  • #31
    EaseOfMovement

    The attached efs computes the Arms Ease of Movement indicator using EFS2 syntax and is enabled for use with multiple intervals and/or external symbols. User defined parameters include the type of average, length, symbol, interval and divisor (for volume adjustment).
    eSignal version 7.9 is required to run this efs.
    Copy [or updated version] of the efs is also available here
    Alex

    Attached Files

    Comment


    • #32
      Dynamic Zones

      The attached efs computes the Dynamic Zones as defined by Zamansky and Stendhal in a TASC article published in July 1997.
      The efs is enabled for use with multiple intervals and/or external symbols. Inputs include length, source, symbol and interval used for the RSI and the periods used to compute the Buy and Sell zones.
      eSignal version 7.9 is required to run this efs.
      Copy [or updated version] of the efs is also available here
      Alex

      Attached Files

      Comment


      • #33
        amFunctions library revision 2

        A new version of the amFunctions Library is now available here
        The new functions added to this revision are Average Move Up and Average Move Down. Syntax and examples are provided in the amFunctions HTML document available at the same link.
        All the functions included in the amFunctions Library can be used with any other eSignal or custom function that accepts a series, Also all the functions can be used with multiple intervals and/or different symbols like the builtin eSignal functions.
        eSignal version 7.9.1 build 732 or later is required to use the amFunctions Library.
        Alex

        Comment


        • #34
          amStudies library revision 3

          A new version of the amStudies Library is now available here. Also in the same folder are the documentation (in HTML format) and the amStudies.xml file (which allows the studies to be listed in the Editor's Toolbox).
          The new functions added to this revision are Chande's CMO and VIDYA. Sample scripts for each have been added here. For more information on the amStudies Library see this post.
          eSignal version 7.9.1 build 732 or later is required to use the amStudies Library.
          Alex

          Comment


          • #35
            Herrick Payoff Index

            The attached efs computes the Herrick Payoff Index. The study requires Open Interest in its calculations and therefore is only applicable to daily data for futures and commodities.
            The HPI was developed by John Herrick and is designed to show the amount of money flowing into or out of a market. Values above zero indicate that money is flowing into the market (which is bullish) while values below zero indicate that money is flowing out of the market (which is bearish).
            The HPI requires two user inputs, Point Value and Factor
            Point Value (default is 100) will depend on the security that is loaded. For example, if the security being loaded was the e-miNY Crude this value would be 500. If the security being loaded was the e-mini S&P this value would be 50.
            Factor is part of a smoothing mechanism and is expressed as a percentage (default is 10% ie 0.10). The results are similar to the smoothing obtained with a moving average. For example, a factor of 0.10 produces results similar to a 19-period moving average.
            If you want the Factor expressed as periods rather than percentage then open the efs and in line 88 replace Factor with (2/(Factor+1)). Then change the default value in line 28 from 0.10 to 19 (or any other value you prefer)
            Copy [or updated version] of this efs is also available here
            Alex

            Attached Files

            Comment


            • #36
              Trend Continuation Factor

              The attached efs computes the Trend Continuation Factor developed by M. H. Pee.
              The indicator helps in identifying trend and direction. Positive values of TCF+ indicate an uptrend while positive values of TCF- indicate a downtrend. TCF+ and TCF- cannot both be positive at the same time, since an uptrend and a downtrend cannot exist concurrently, however they can be both negative which indicates consolidation.
              The efs is enabled for use with multiple intervals and/or symbols and requires the easyArray.efsLib library. For information on the easyArray library and the ezArray() function used in the efs see this post from earlier in this same thread.
              The script also includes the logic required to create and maintain an array using a conventional method (ie without the use of the ezArray() function). The reason for including this additional logic is to provide an "apples to apples" comparison that shows how the ezArray() function simplifies the process of creating and maintaining arrays. Comments contained in the script illustrate the differences between the two methods and provide the necessary instructions to convert the efs to use either method.
              Copy [or updated version] of this efs is also available here
              Alex

              Attached Files

              Comment


              • #37
                Candlestick Indicator

                The attached efs replicates (as closely as I think is possible at this time) a candlestick chart in an indicator window. The symbol to be plotted can be modified through Edit Studies
                In order to save on resources the script is set by default to plot 200 historical candlestick wicks (which are drawn as lines). This value can be modified in Edit Studies
                Copy [or updated version] of this efs is also available here
                Alex

                Attached Files

                Comment


                • #38
                  Even though the Candlestick Indicator.efs posted in the prior message plots as a non-price study we can apply to it all the price studies that accept external symbols such as those for example in the EFS2 Custom folder.
                  To do this we need to implement only a small change to those price studies (for example customBB.efs or customDonchian.efs, etc) and then use the study overlay functionality.
                  Open any one of those studies using the EFS Editor and change the setPriceStudy(true) statement in preMain to setPriceStudy(false). Then save the study with a different name (for example customBB-NPS.efs where NPS is for Non-Price Study).
                  Once that is done load the modified study in the same chart in which you have the Candlestick indicator.efs and set it to the same symbol. It will now display as a non price study. Click and drag the study into the Candlestick Indicator pane while pressing the <Shift> key. The study will now be overlayed on the Candlestick Indicator. At this point right click the indicator pane and make sure that the scale of both the Candlestick Indicator and the study are set to Display and Scale on the same side (right or left whichever you want to use). The scales will now be correctly aligned.
                  In the following image you can see that there are two instances of the Candlestick indicator each running a symbol that is different from the main window and each with its own "price" study.
                  Alex

                  Comment


                  • #39
                    Updated versions of the amStudies.efsLib and amBlauStudies.efsLib functions libraries are now available. These are minor revisions containing only some internal modifications to improve efficiency
                    Alex

                    Comment


                    • #40
                      amFunctions library revision 3

                      A new version of the amFunctions Library is now available here
                      The new functions added to this revision are Average Deviation, Standard Deviation and Standard Error.
                      Syntax and examples are provided in the amFunctions HTML document available at the same link.
                      All the functions included in the amFunctions Library can be used with any other eSignal or custom function that accepts a series, Also all the functions can be used with multiple intervals and/or different symbols like the builtin eSignal functions.
                      eSignal version 7.9.1 build 732 or later is required to use the amFunctions Library.
                      Alex

                      Comment


                      • #41
                        PivotPointsAll2 - revision

                        The PivotPointsAll2.efs has been updated and now includes the option to plot the Pivots as defined by Tom DeMark (see the enclosed image for the definition).
                        This revision can be downloaded from the original post at the link above or here
                        Alex


                        Comment


                        • #42
                          amBlauStudies library revision 2

                          A new version of the amBlauStudies.efsLib is now available here
                          The new functions added to this revision are SMI_Trade and TSI_ Trade which were previously released as EFSs. Syntax and examples are provided in the amBlauStudies HTML document available at the same link.
                          eSignal version 7.9.1 (build 732) or later is required to run the amBlauStudies function library
                          Alex

                          Comment


                          • #43
                            A revised zip file containing basic examples of all the Blau Studies available in the amBlauStudies function library is now available here Also included in the zip file are Blau ErgodicTSI.efs and Blau ErgodicCSI.efs which are the fully customizable versions of those studies and which can be used as examples to modify the other studies in the zip file.
                            Alex

                            Comment


                            • #44
                              Standard Error Bands

                              The attached efs computes the Standard Error Bands developed by Jon Andersen and published in a 1996 TAS&C article.
                              The efs is enabled for use with multiple intervals and/or symbols and all the required inputs can be modified through Edit Studies.
                              To run this study you need the amStudies.efsLib library and the amFunctions.efsLib library.
                              Copy [or updated version] of this efs is also available here
                              Alex

                              Attached Files

                              Comment


                              • #45
                                Tick Line Momentum Oscillator

                                The attached efs computes the Tick Line Momentum Oscillator developed by Daniel E. Downing and published in the article "Using The Tick In A Short-Term Indicator", in the January 94 issue of TASC
                                The efs is enabled for use with multiple intervals and/or external symbols.
                                eSignal version 7.9 is required to run this efs.
                                Copy [or updated version] of the efs is also available here
                                Alex

                                Attached Files

                                Comment

                                Working...
                                X