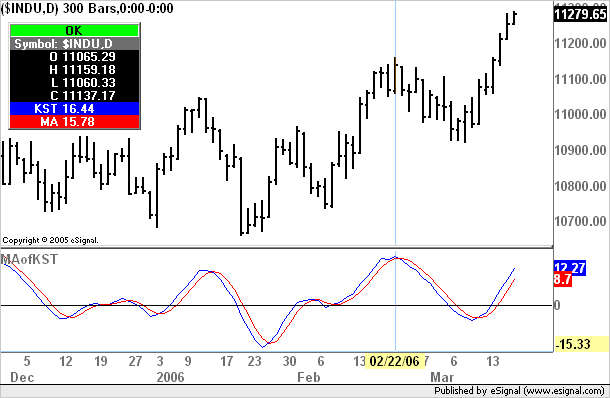
Announcement

Collapse
No announcement yet.

Some simple EFS2 scripts

Collapse
This topic is closed.
X
X
 
  • Filter
  • Time
  • Show
Clear All
new posts

  • #46
    Fisher Transform

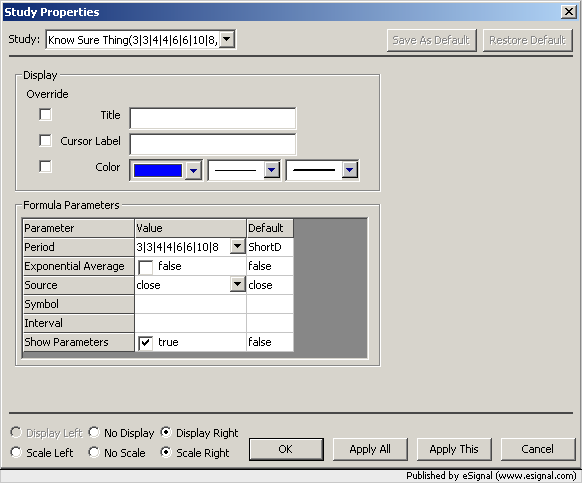
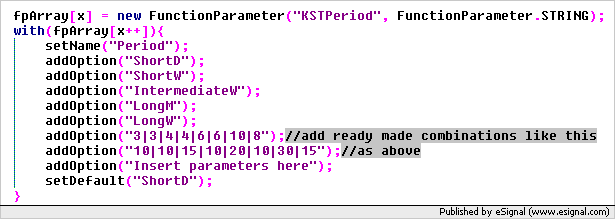
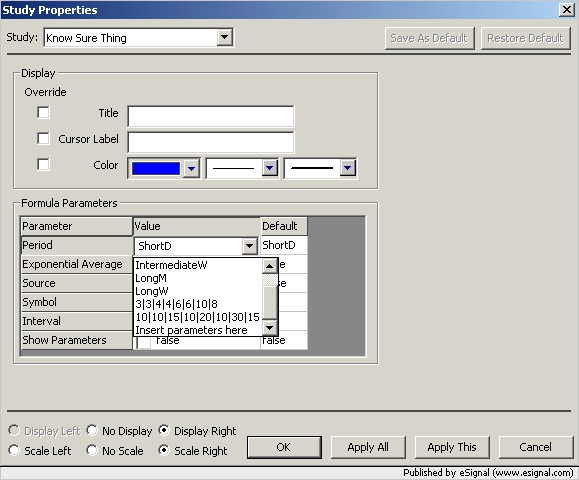
    The attached efs is a variation of the Fisher.efs posted earlier in this thread and is configured to compute the indicator using any one of the studies listed in the Study parameter that can be accessed through Edit Studies (more could be added if required). To change the parameters for any one of the studies just type the new parameters in place of the existing ones.
    The efs is also enabled for use with multiple intervals and/or external symbols
    eSignal version 7.9 is required to run this efs.
    Alex
    Attached Files

    Comment


    • #47
      amStudies library revision 4

      A new version of the amStudies Library is now available here. Also in the same folder are the documentation (in HTML format) and the amStudies.xml file (which allows the studies to be listed in the Editor's Toolbox). For more information on the amStudies Library see this post.
      The new function added to this revision is the TRIX. A fully customizable efs of this indicator (enabled also for multiple intervals and/or symbols) has been added here.
      eSignal version 7.9.1 build 732 or later is required to use the amStudies Library.
      Alex

      Comment


      • #48
        TRIX with Moving Average

        The attached efs uses the amTRIX() function to compute the indicator and its moving average. The study is enabled for use with multiple intervals and/or external symbols.
        eSignal version 7.9.1 and the amStudies.efsLib library are required to run this efs. For more information on the amStudies library see this post.
        Copy [or updated version] of the efs is also available here
        Alex

        Attached Files

        Comment


        • #49
          IE/2

          The attached efs computes the IE/2 average developed by Tim Tillson and described in his article "Smoothing Techniques for More Accurate Signals." published in the January 1998 issue of TAS&C.
          This is the standalone version of the script posted in this thread and is enabled for use with multiple intervals and/or external symbols.
          eSignal version 7.9 or later is required to run the efs.
          Copy [or updated version] of the efs is also available here
          Alex

          Attached Files

          Comment


          • #50
            Chaikin Money Flow

            The attached efs computes the Chaikin MoneyFlow and is enabled for use with multiple intervals and/or external symbols.
            User defined parameters include the period over which the study is calculated, the symbol and interval to be used, the option to display the plot as a line or histogram and the option to show/hide the study parameters.
            eSignal version 7.9 or later is required to run the efs.
            Copy [or updated version] of the efs is also available here
            Alex


            Attached Files

            Comment


            • #51
              Relative Vigor Index

              The attached efs computes the Relative Vigor Index developed by John Ehler and published in the January 2002 issue of TAS&C. The study is enabled for use with multiple intervals and/or external symbols.
              User defined parameters include the period used to calculate the indicator, the symbol and interval to be used and the option to show/hide the study parameters.
              eSignal version 7.9 or later is required to run the efs.
              Copy [or updated version] of the efs is also available here
              Alex

              Attached Files

              Comment


              • #52
                Chaikin Oscillator

                The attached efs computes the Chaikin Oscillator and is enabled for use with multiple intervals and/or external symbols.
                User defined parameters include the lengths of the two averages used to calculate the indicator, the symbol and interval to be used, the option to display the plot as a line or histogram and the option to show/hide the study parameters.
                eSignal version 7.9 or later is required to run the efs.
                Copy [or updated version] of the efs is also available here
                Alex

                Attached Files

                Comment


                • #53
                  amStudies library revision 5

                  A new version of the amStudies Library is now available here. Also in the same folder are the documentation (in HTML format) and the amStudies.xml file (which allows the studies to be listed in the Editor's Toolbox). For more information on the amStudies Library see this post.
                  The new function added to this revision is the KST (Know Sure Thing). This indicator was developed by Martin Pring and described in the "Summed Rate Of Change (KST)" article published in the September 92 issue of TAS&C. Please refer to that article and to the amStudies documentation for an explanation of the required parameters.
                  eSignal version 7.9.1 build 732 or later is required to use the amStudies Library.
                  Alex

                  Comment


                  • #54
                    KST (Know Sure Thing)

                    The attached efs uses the amKST() function included in the amStudies library to plot Martin Pring's KST (Know Sure Thing) indicator and is enabled for use with multiple intervals and external symbols..
                    The parameters for the KST include the period(s) used for the calculation (see quote box below for an explanation), the type of average used ie simple (the default) or exponential, the source (default is Close) and the symbol and/or Interval used.
                    eSignal version 7.9.1 build 732 or later is required to run the efs.
                    Copy [or updated version] of the efs is also available here
                    Alex

                    The Period parameter of the amKST() function must be one of the following:

                    • a string containing the periods of each roc and ma study ORd together in the following sequence
                    "roc1|ma1|roc2|ma2|roc3|ma3|roc4|ma4"
                    for example "10|10|15|10|20|10|30|15"

                    • any one of the following strings
                    "ShortD", "ShortW", "IntermediateW", "LongM", "LongW"
                    These strings correspond to preset combinations of periods as suggested by Pring in his article "Summed Rate Of Change (KST)" published in the September 92 issue of TAS&C (they also use the same naming convention)

                    So the period parameter could be written in either one of the following ways and in the case of this example would return the same exact plot (see enclosed image)
                    amKST("ShortW", false)
                    or
                    amKST("3|3|4|4|6|6|10|8", false)


                    In the attached efs all the preset combinations can be selected through Edit Studies. The efs also offers an additional option (which is marked as Insert parameters here) in which the individual settings can be input manually (see following image). Note that when you insert the parameters manually in Edit Studies you must not enclose them in quotes"".


                    If you would like to create some additional ready made combinations that can be selected through Edit Studies just insert them as addOption() statements in the Function Parameter (see following image)


                    Once you have done that these custom options will become available in Edit Studies (see following image)

                    Attached Files

                    Comment


                    • #55
                      KST with Moving Average

                      The attached efs uses the amKST() function to compute the KST indicator and its moving average (see also prior message). The study is enabled for use with multiple intervals and/or external symbols.
                      eSignal version 7.9.1 and the amStudies.efsLib library are required to run this efs. For more information on the amStudies library see this post.
                      Copy [or updated version] of the efs is also available here
                      Alex

                      Attached Files

                      Comment


                      • #56
                        Parabolic SAR

                        The attached efs replicates the Parabolic indicator found in TradeStation 2000i and is enabled for use with multiple intervals.
                        eSignal version 7.9.1 or later and the Parabolic.efsLib function library are required to run this efs. The Parabolic.efsLib function library can be found here together with its documentation.
                        Copy [or updated version] of the efs is also available here
                        Alex

                        Note1: Compared to the equivalent TradeStation function the Parabolic function used by this efs has an additional user defined parameter which is used to set the maximum acceleration factor.
                        Note2: As with the TradeStation 2000i Parabolic indicator this efs displaces forward by one bar the value calculated by the Parabolic function which means that it will reverse only once a bar is completed. To have the indicator reverse in real time on the current bar see the notes contained at the end of the script.

                        Attached Files

                        Comment


                        • #57
                          Parabolic Oscillator

                          The attached efs computes the Parabolic Oscillator and is enabled for use with multiple intervals. The oscillator represents the difference between the Close and the Parabolic indicator value.
                          eSignal version 7.9.1 or later and the Parabolic.efsLib function library are required to run this efs.
                          Copy [or updated version] of the efs is also available here
                          Alex

                          Attached Files

                          Comment


                          • #58
                            amFunctions library revision 4

                            A new version of the amFunctions Library is now available here. Also contained at the same location is the documentation in HTML format. For more information on the amFunctions Library see this post.
                            The new function added to this revision is the Median. This function sorts the series that is being passed to it and returns the median for the specified period. If the period is an odd number (eg 3, 5, 7, etc) it uses the middle value while if it is an even number (eg 4, 6, 8, etc) it finds the two innermost values and averages them. Enclosed below is a basic code example showing how to use the function to calculate the Median of the Close over 7 periods. The function can be used with any eSignal or custom series and can be computed on external intervals and/or symbols
                            eSignal version 7.9.1 build 732 or later is required to use the amFunctions Library.
                            Alex

                            PHP Code:
                            function preMain(){
                                
                            setPriceStudy(true);
                                
                            setCursorLabelName("Median");
                            }

                            var 
                            amLib addLibrary("amFunctions.efsLib");//call the library
                            var xMedian null;//declare the variable

                            function main(){
                                if(
                            xMedian==nullxMedian amLib.amMedian(7,close());//initialize the function
                                
                            return xMedian.getValue(0);//return the value

                            Comment


                            • #59
                              Headley Acceleration Bands

                              The attached efs computes the Acceleration Bands developed by Price Headley and is enabled for use with multiple intervals and/or external symbols.
                              eSignal version 7.9.1 or later is required to run the efs.
                              Copy [or updated version] of the efs is also available here
                              Alex

                              Attached Files

                              Comment


                              • #60
                                Headley Momentum Divergence

                                The attached efs computes the Momentum Divergence indicator developed by Price Headley and is enabled for use with multiple intervals and/or external symbols.
                                eSignal version 7.9.1 or later is required to run the efs.
                                Copy [or updated version] of the efs is also available [url=https://share.dataservices.theice.com/sharedaccess/ACM%20Test/Formulas-EFS2/Headley%20Momentum%20Divergence.efs?download=true]/url]
                                Alex

                                Attached Files

                                Comment

                                Working...
                                X