Announcement

Collapse
No announcement yet.

Some simple EFS2 scripts

Collapse
This topic is closed.
X
X
 
  • Filter
  • Time
  • Show
Clear All
new posts

  • #16
    Robert Krausz Fibonacci Zones

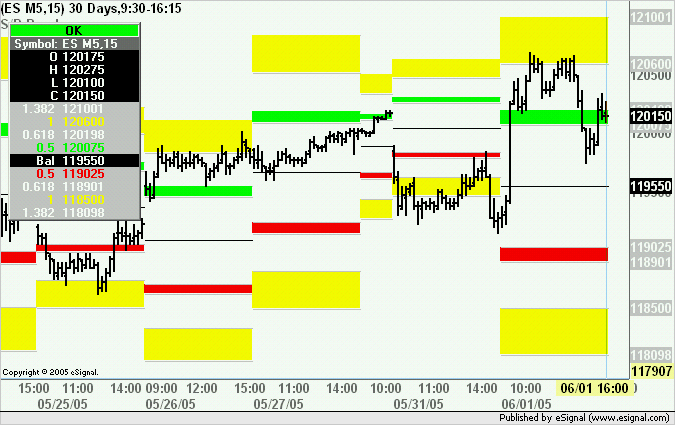
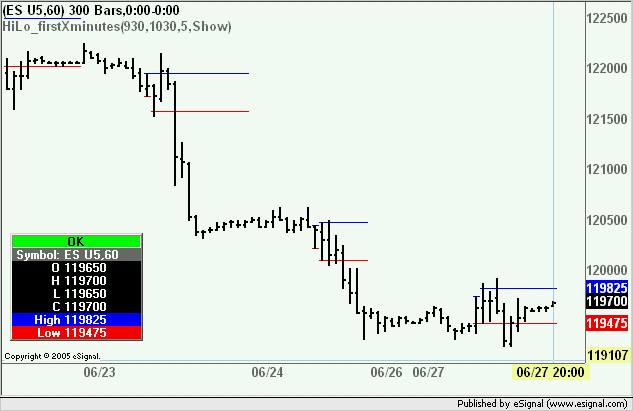
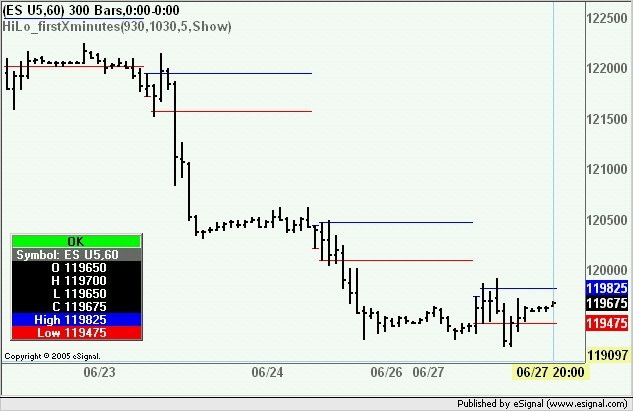
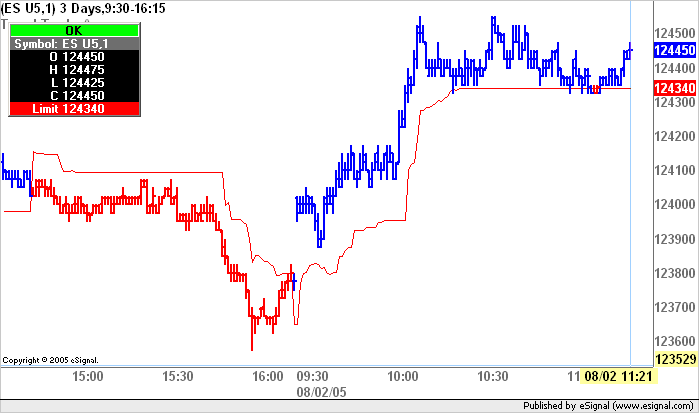
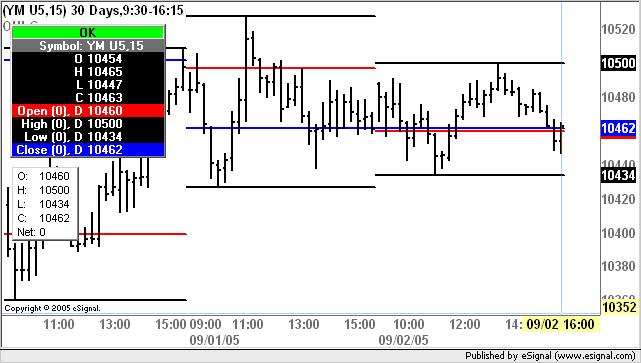
    The attached efs computes the Fib Zones as defined by Robert Krausz in a TAS&C interview published in 1998.
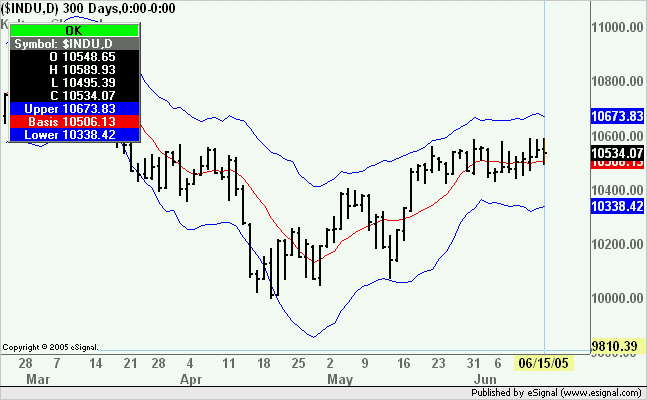
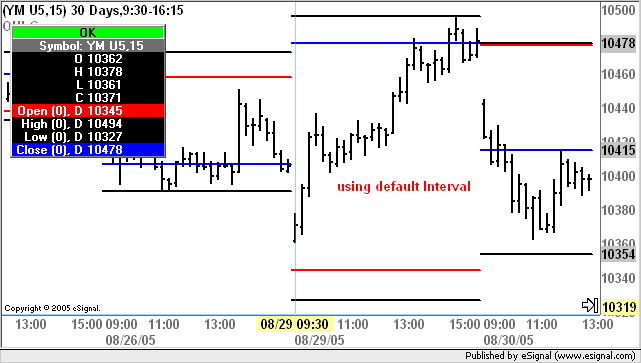
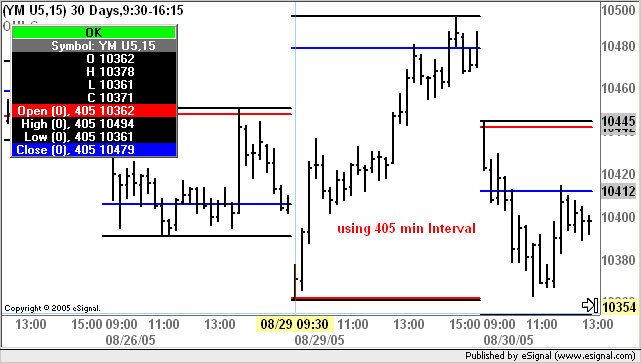
    The efs computes the range of a "higher" interval (defaults are Daily for intraday and Weekly for daily charts) and multiplies that by user defined Fibonacci values (defaults are 0.500, 0.618, 1.000, 1.382). It then adds/subtracts the resulting values to the Balance Line (ie the average of the range plus the prior close of the higher interval) thereby creating projected zones of support/resistance and paints the backgrounds of these zones.
    User defined settings include Interval, the Fibonacci multipliers and whether the background color is on or off. As an aside this efs can be used as an example of how to paint the background of a bar with multiple colors using the setBarBgColor() function with the optional yMin and yMax parameters.
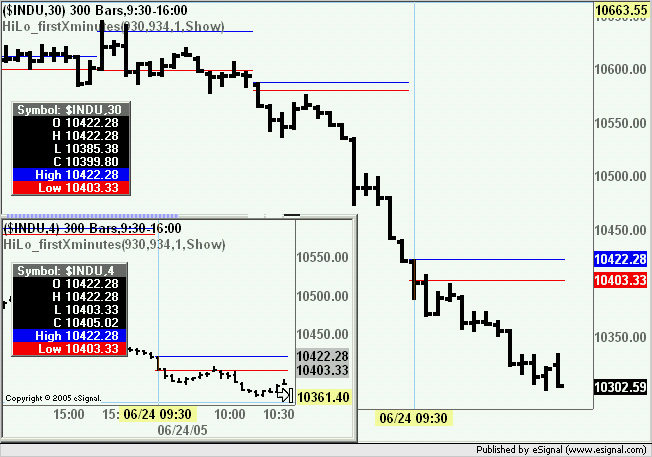
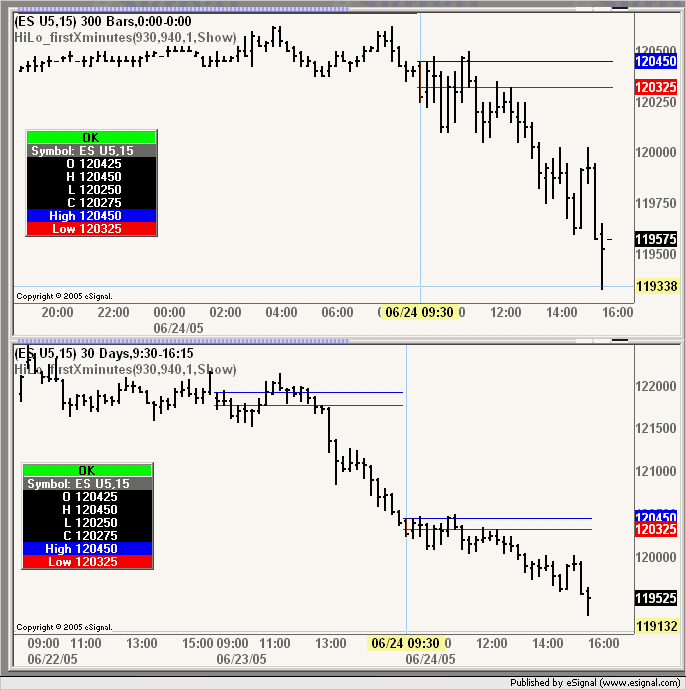
    The efs can be run on any chart and the projected zones can be based on any interval.
    Copy [or updated version] of the efs is also available here
    Alex

    Attached Files

    Comment


    • #17
      Keltner Channel

      The attached efs computes the Keltner channel using EFS2 syntax and is enabled for use with multiple intervals and/or external symbols. User defined parameters include type of average used (simple or exponential), source, length, multiplier, offset and colors of the average and the bands.
      Note that eSignal version 7.9.1 (or later) is required to run this efs as it uses the enhanced functionality provided by the efsInternal() function. For more information on the efsInternal() function see this thread.
      Alex


      Note: Copy [or updated version] of this efs is also available here
      Attached Files

      Comment


      • #18
        Multi-purpose Moving Average Channel

        The attached MAChannel2.efs is the EFS2 version of the one originally posted here and is now enabled for use with multiple intervals and/or external symbols. It also includes the option to base the channels on standard deviation
        As in the original script when the study is first loaded it appears only as a simple moving average since the default value for the channel is 0. To plot the bands you need to select the type of channel and apply a value.
        This efs requires eSignal version 7.9.1 (or later) as it makes use of the enhanced functionality provided by the efsInternal() function. For more information on the efsInternal() function see this thread.
        Alex

        Note: Copy [or updated version] of this efs is also available here
        Attached Files

        Comment


        • #19
          High and Low of the first X minutes

          The attached efs is a revision of the HiLo_firstXminutes.efs first posted here and then slightly modified in this post.
          This new version shows how EFS2 makes it very easy to considerably enhance an existing script with only some minor changes. Download both versions and compare them using the Editor to see how these changes were implemented.

          The original version of HiLo_firstXminutes was limited in its ability to determine the opening range as it based its calculations on the chart interval. So, if for example you were plotting a 30 minute chart you could not compute the opening range of any period smaller then the chart interval but only of the first 30 minutes or multiples thereof.
          This new version no longer has that limitation because it uses the external interval you define in Edit Studies as the base for the calculations of the opening range. This means that even if you are plotting for example a 30 minute chart you can now see the High and Low of the first 4 minutes (see following image)


          Also the efs can calculate the same range whether you are plotting all sessions or only RTH. In the following two images you can see that I define the opening range as the time between 9:30 and 9:40 using a 15 minute chart of ES U5 and both the all sessions and RTH charts return the same values


          The user defined inputs are the following
          Start Time - The time from which you want to begin tracking the opening range. Default is 930
          End Time - The time at which you want to end tracking the opening range. Default is 1030
          Ext Interval Used - This is the external interval used to compute the range. The default is set to 5 but can be otherwise defined to adapt the script to your needs. If for example you want to define the opening range of the first 12 minutes you can use 1, 2, 3, 4, 6 or 12 minutes as the external interval because they all fit exactly in 12.
          Display - This option displays or hides the High/Low lines during the first nn minutes defined in Edit Studies. To see the purpose of this option see this post

          Requirements and usage notes
          - When using this efs make sure that the chart has a Time Template that will load at least 2 days of data for the external interval.
          - If the Time Template for the external interval is set for 00:00-00:00 Start/End times and the chart is set to plot all sessions the efs will plot only to the end of the day (see first image below)
          - If instead the Time Template for the external interval is set for RTH and the chart is set to plot all sessions then the lines will extend into the next day until the new Start time set in Edit Studies (see second image below)
          Note that this script requires eSignal version 7.9.1 (build 730) or later to run as it uses the enhanced functionality of efsInternal() available only from that version onwards
          Alex


          Note: Copy [or updated version] of this efs is also available here
          Attached Files

          Comment


          • #20
            Trading the Trend revision 2

            The attached efs is a revision of the Trading the trend.efs originally posted in this thread and is now enabled for use with multiple intervals. Options to adjust the period over which the indicator is calculated and the multiplier have also been added.
            Note that as in the original version the indicator will switch trends only at the completion of the interval on which it is being calculated
            The script uses the new getBarStateInterval() function and requires eSignal version 7.9.1 (or later) to run.
            Alex


            Note: Copy [or updated version] of this efs is also available here
            Attached Files

            Comment


            • #21
              amStudies library revision 2

              A new version of the amStudies Library is now available here. Also in the same folder are the documentation (in HTML format) and the amStudies.xml file (which allows the studies to be listed in the Editor's Toolbox).
              The new functions are Smoothed Moving Average, VWAP Approximation [for use with minute based intervals only] and Zero Lag Moving Average. Sample scripts for each have been added here. For more information on the amStudies Library see this post.
              Note that this revision of the amStudies Library requires eSignal version 7.9.1 (build 732) or later
              Alex

              Comment


              • #22
                amBlauStudies library

                The amBlauStudies Library is now available here. Download and save the file to the FunctionLibrary folder in the eSignal directory.
                Currently included in the amBlauStudies Library are the following functions: CMI (Candlestick Momentum Indicator), CSI (Candlestick Indicator), DI (Divergence Indicator), DS_Stochastic (Double Smoothed Stochastic), DTI (Directional Trend Index), DX (Double Exponential Average), MDI (Mean Deviation Indicator), SMI (Stochastic Momentum Index), TSI (True Strength Index) and TX (Triple Exponential Average). All the functions are taken from the book "Momentum, Direction and Divergence" by William Blau.
                Syntax and examples are provided in the amBlauStudies HTML document available at the same link.
                All the studies included in the amBlauStudies Library can be used with any other eSignal or custom function that accepts a series, Also all the studies can be used with multiple intervals or different symbols like the builtin eSignal studies.
                eSignal version 7.9.1 build 732 or later is required to use the amStudies Library.
                Alex

                Comment


                • #23
                  I have uploaded here a zip file containing basic sample scripts for each study available in the amBlauStudies Function Library.
                  Variable names etc used throughout the scripts replicate those used by William Blau in his book "Momentum, Direction and Divergence".
                  Some studies such as for example _Blau SMI_Trade or _Blau TSI_Trade that are currently provided as efs(s) will eventually be converted into functions and added to a future revision of the amBlauStudies library.
                  Also included in the zip file are Blau ErgodicTSI.efs and Blau ErgodicCSI.efs which are the fully customizable versions of those studies and which can be used as examples to modify the other studies in the zip file.
                  The amBlauStudies function library is required to run any of these studies (see prior post for the link to the library)
                  Alex

                  Comment


                  • #24
                    Misc revisions

                    The EFS listed below have been updated and the revisions can be downloaded from their respective posts
                    Alex

                    SR Bands.efs - improved code efficiency.
                    High-Low.efs - improved code efficiency.
                    Ichimoku2.efs - fixed background color issue, improved code efficiency.
                    Thermometer2.efs - improved code efficiency.

                    Comment


                    • #25
                      PivotPointsAll2 - error correction

                      There was an error in the PivotPointsAll2.efs which caused the Woodie Pivots to be calculated using the prior day's Open instead of the current day's Open.
                      The efs has now been replaced with the corrected version. You can download it again from the original post and/or the FileShare group or replace line 117 with the one shown below
                      Alex

                      PHP Code:
                      vOpen  xOpen.getValue(-Lookback+1); 

                      Comment


                      • #26
                        Open-High-Low-Close

                        The attached OHLC.efs is a variation of the High-Low.efs posted earlier in this same thread.
                        This version will plot the Open, High, Low and Close of any interval for the selected Lookback. By default if the chart is intraday it will plot the current day's OHLC, if the chart is daily then it will plot the current week's OHLC and if weekly the current month's values.
                        The Cursor Label will indicate which Lookback bar and Interval are selected for the OHLC. For example High(0), D is the High for the current daily bar, High(1), 60 is the High of the prior bar on a 60 minute interval.
                        User defined parameters are the following
                        Interval - This sets the interval of the Open/High/Low/Close (see Notes below)
                        Lookback - This option allows to select from which bar of the user defined interval we want to plot the OHLC (0 is current bar, 1 is prior bar, 2 is two bars ago, etc)
                        Params - Switches on (true) or off (false) the display of the parameters in the chart. Default is false.
                        To run this study you need eSignal version 7.9 Beta 1 or later.
                        Alex

                        Copy [or updated version] of this efs is also available here


                        Notes: The efs also allows to retrieve the OHLC for the Regular Trading Hours of those symbols such as for example YM or AB that do not have an =2 extension.
                        If the Intraday Default is not set for RTH create a User Defined 405 minute Interval in the Time Template and set the Start/End times for that interval to 9:30-16:15 (if in Eastern Time zone else adjust accordingly). Then using Edit Studies insert 405 as the Interval parameter of the efs.
                        In the images below you can see the difference when using the default setting (which retrieves the OHLC of the daily bar) and when using 405 minutes.


                        Attached Files

                        Comment


                        • #27
                          amFunctions library

                          The amFunctions Library is now available here. Download and save the file to the FunctionLibrary folder in the eSignal directory.
                          Currently included in the amFunctions Library are the following functions: Range, TrueHigh, TrueLow, TrueRange and TrueRangeCust. Syntax and examples are provided in the amFunctions HTML document available at the same link.
                          All the functions included in the amFunctions Library can be used with any other eSignal or custom function that accepts a series, Also all the functions can be used with multiple intervals or different symbols like the builtin eSignal functions.
                          eSignal version 7.9.1 build 732 or later is required to use the amFunctions Function Library.
                          Alex

                          Comment


                          • #28
                            Correlation Coefficient

                            The attached efs calculates the correlation coefficient between two symbols.
                            User defined parameters include the two symbols used to calculate the correlation (by default these are the charted symbol and $INDU), the source (default is Close) and the period over which the indicator is calculated (default is 25).
                            eSignal version 7.9 is required to run this efs.
                            Copy [or updated version] of the efs is also available here
                            Alex

                            Attached Files

                            Comment


                            • #29
                              Fisher Transform

                              The attached efs computes the Fisher Transform using EFS2 syntax and is enabled for use with multiple intervals and/or external symbols. User defined parameters include the source (default is (High+Low)/2), length (default is 10), symbol and interval to be used.
                              eSignal version 7.9 is required to run this efs.
                              Copy [or updated version] of the efs is also available here
                              Alex

                              Attached Files

                              Comment


                              • #30
                                ezArray

                                The easyArray.efsLib function library which is available here contains the function ezArray() which will simplify considerably the task of creating and maintaining any number of arrays.
                                To demonstrate how it works I will be using a Linear Regression formula and and assuming that we need to retrieve the values of the prior two bars so as to color the plot in green or red if the current and prior values of the Linear Regression are increasing or decreasing. Here is the original script

                                PHP Code:
                                function preMain(){
                                    
                                setPriceStudy(true);
                                    
                                setStudyTitle("Linear Regression");
                                    
                                setCursorLabelName("LR");
                                    
                                setDefaultBarThickness(3);
                                    
                                setPlotType(PLOTTYPE_INSTANTCOLORLINE);
                                }

                                function 
                                main(Length) {
                                    if(
                                Length == nullLength 25;
                                    var 
                                sum 0;
                                    var 
                                LR 0;
                                    for(var 
                                Length0i--){
                                        
                                sum += (- (Length 1) / 3) * close(Length);
                                    }    
                                    
                                LR / (Length * (Length 1)) * sum;
                                    return 
                                LR;

                                One of the solutions available to accomplish this task is to create an array so as to store the required historical values that we need to use in the conditions. This is how we would normally implement it (comments are in the script). In the image that follows you can see the result of these changes.

                                PHP Code:
                                function preMain(){
                                    
                                setPriceStudy(true);
                                    
                                setStudyTitle("Linear Regression");
                                    
                                setCursorLabelName("LR");
                                    
                                setDefaultBarThickness(3);
                                    
                                setPlotType(PLOTTYPE_INSTANTCOLORLINE);
                                }

                                var 
                                myArray null;//declare the array
                                var LR null;//declare LR as a global variable

                                function main(Length) {
                                    if(
                                Length == nullLength 25;
                                    var 
                                sum 0;
                                    
                                //var LR = 0;//removed as this is now a global variable
                                    //begin array section
                                    
                                if(myArray==nullmyArray = new Array(3);//set the length of the array (we only need to go back 2 bars)
                                    
                                if(getBarState()==BARSTATE_NEWBAR){//if a new bar is created
                                        
                                myArray.pop();//remove the oldest element of the array
                                        
                                myArray.unshift(LR);//add the last computed value of LR to the array
                                    
                                }
                                    
                                //end array section
                                    
                                for(var Length0i--){
                                        
                                sum += (- (Length 1) / 3) * close(Length);
                                    }    
                                    
                                LR / (Length * (Length 1)) * sum;
                                    
                                myArray[0] = LR;//assign current value of LR to the first element of the array
                                    //begin section to color the plot using array
                                    
                                if(myArray[0]>myArray[1]&&myArray[1]>myArray[2]) setBarFgColor(Color.lime);
                                    else if(
                                myArray[0]<myArray[1]&&myArray[1]<myArray[2]) setBarFgColor(Color.red);
                                    else 
                                setBarFgColor(Color.lightgrey);
                                    
                                //end section to color the plot
                                    
                                return LR;


                                As you can see creating and maintaining the array can entail quite a lot of changes.
                                The ezArray() function instead makes this a very simple task. In fact here is how the same efs would be written using the ezArray() function.

                                PHP Code:
                                function preMain(){
                                    
                                setPriceStudy(true);
                                    
                                setStudyTitle("Linear Regression");
                                    
                                setCursorLabelName("LR");
                                    
                                setDefaultBarThickness(3);
                                    
                                setPlotType(PLOTTYPE_INSTANTCOLORLINE);
                                }
                                var 
                                myLib addLibrary("easyArray.efsLib");//add the function library
                                function main(Length) {
                                    if(
                                Length == nullLength 25;
                                    var 
                                sum 0;
                                    var 
                                LR 0;
                                    for(var 
                                Length0i--){
                                        
                                sum += (- (Length 1) / 3) * close(Length);
                                    }    
                                    
                                LR / (Length * (Length 1)) * sum;
                                    var 
                                myArray myLib.ezArray(LR,3,"LR");//create the array using the ezArray() function
                                    //begin section to color the plot using array
                                    
                                if(myArray[0]>myArray[1]&&myArray[1]>myArray[2]) setBarFgColor(Color.lime);
                                    else if(
                                myArray[0]<myArray[1]&&myArray[1]<myArray[2]) setBarFgColor(Color.red);
                                    else 
                                setBarFgColor(Color.lightgrey);
                                    
                                //end section to color the plot
                                    
                                return LR;

                                As you can see it was necessary to add only 2 lines of code, one to load the easyArray.efsLib library using the addLibrary call and the other to create and maintain the array using the ezArray() function. No other changes to the efs were required and the results are identical


                                USAGE:
                                Save the attached easyArray.efsLib file in the FunctionLibrary folder in eSignal. Instructions on how to use the ezArray() function are contained in the easyArray Library.htm document which is available here.
                                The syntax required by the ezArray() function is the following
                                ezArray(value, length, TagName)
                                The parameters are
                                value - this is the variable used to create the array. It can also be a an equation such as for example (high(0)+low(0))/2
                                length - this defines the length of the array
                                TagName - this can be a string or a number and must be unique for each array you create (even if you are creating two or more arrays of the same value)
                                IMPORTANT NOTES
                                a) All three parameters are required
                                b) The name of each array AND the TagName must always be unique to that array otherwise you could get unexpected (and incorrect) results

                                At this time I have tested the ezArray() function under several (and different) conditions and so far I have not found any problems. However I would suggest that you thoroughly check the results returned by the function if you plan on implementing it in your scripts.
                                Alex

                                Comment

                                Working...
                                X