...if I may bring up something about the markets and the stars.
Happiness is not a reward- it is a consequence.
Suffering is not a punishment- it is a result.
God designed the human machine to run on Himself. He is the fuel our spirits
were designed to burn... That is why it is no good asking God to make us happy in our own way
without bothering about religion. God cannot give us a happiness apart from Himself,
because there is no such thing.
- C.S. Lewis
Some things I'm seeing. Starting Friday I will be on the lookout for a long tail candlestick, that's the bootom of this decline. Time is almost up now vs the long tail Monday. Also if a certain price is reached, 1016, then I will start long again and this could happen Friday. BUT 1032 is very strong support (1030 from a Gann perspective) and the market could just go sideways into the turn dates of Nov 24-26.I'll have to listen to what the market tells me.
Chris
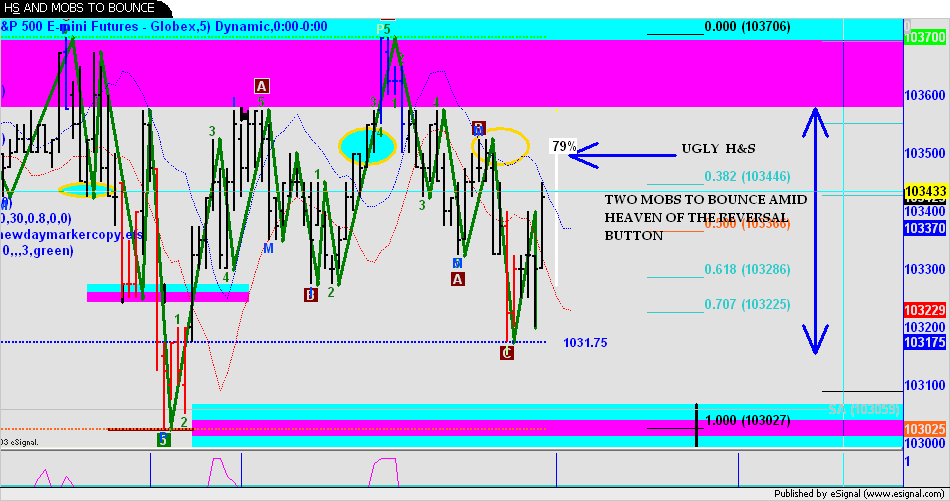
This is of great importance . 1032 is a damm support , for once broken the way is downhill
I add a tiny AB=CD ....should make us hope for the development of the day
Thanks for your invaluable Insight
One technique I use is unconventional but works is to connect bottoms with Fib retracement extensions but input sqrt's instead. The chart shows the bottom Aug 6 connected to Sept 30 bottom with the Fib tool yields the bottom for the next decline, or sqrt 2 1018.32 in the blue color. The yellow Fib retracement/extension is connecting the bottoms Sept 30 and Oct 24 and shows a cluster at 1030-1031. But what I see is if 1030 is broken the S&P could decline for the whole rally since March 12 all the way to 978, at least according to this tool.
Originally posted by theplumber One technique I use is unconventional but works is to connect bottoms with Fib retracement extensions but input sqrt's instead. The chart shows the bottom Aug 6 connected to Sept 30 bottom with the Fib tool yields the bottom for the next decline, or sqrt 2 1018.32 in the blue color. The yellow Fib retracement/extension is connecting the bottoms Sept 30 and Oct 24 and shows a cluster at 1030-1031. But what I see is if 1030 is broken the S&P could decline for the whole rally since March 12 all the way to 978, at least according to this tool.
Just to follow up on this technique, because it's a function of lows it will only work with lows, todays bounce hit the first cluster line.
I was asked a few days ago how I came up with the target date of Dec 11 for a high. That date was an astro date (SuperTiming date to be exact) but it was also a geometry date. Micheal Jenkins has a technique ,all my stuff is variations of his work, where he uses a compass on a printed chart to find a point in space and make an arc to pinpoint a high (in his book "Chart reading for professional traders") and this is my variation. Has worked pretty good so far for finding tradable tops.The top is where the arc is exactly vertical, hitting the top horizontal bar.
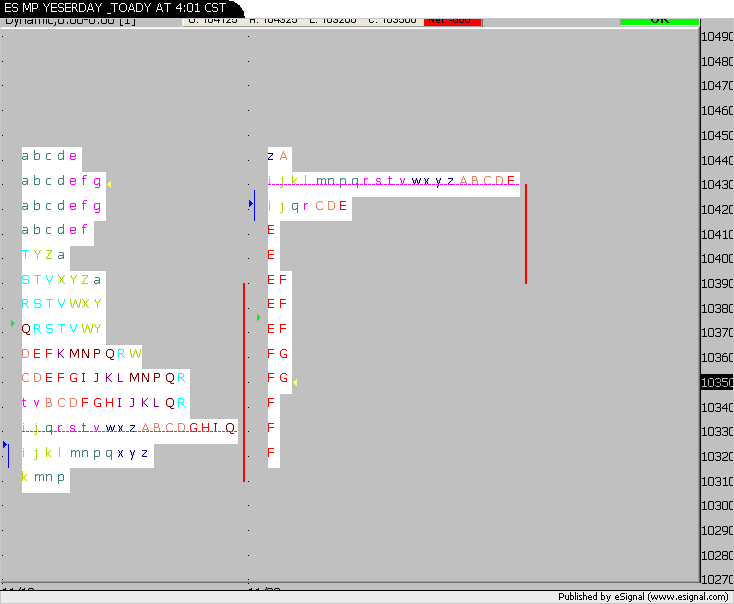
This decline could be over, but it doesn't feel right. The chart is the square of 144, I got the reversal candle hitting the red line but the time window is still open so the S&P may go down to the blue line.
This chart is the seasonals forcast and has played out perfectly so far. Got the rally in the begining of the month, this decline and all that's left is the rally into the end of the month. The blue box is November.
 Tweet
Tweet

Comment