Announcement

Collapse
No announcement yet.

Fibo & Geometry

Collapse
X
 
  • Filter
  • Time
  • Show
Clear All
new posts

  • #61
    But ievery candle in back in the cycle 9 or 13 are red

    Sorry, 9 or 11 or 13 Try to check even backwards.
    Last edited by fabrizio; 10-23-2003, 12:31 AM.
    Fabrizio L. Jorio Fili

    Comment


    • #62
      I'm a trader so my memory or attention span doesn't go back that far. Since July 2002 lows is where I put my odds.


      Originally posted by fabrizio
      But ievery candle in back in the cycle 9 or 13 are red

      Sorry, 9 or 11 or 13 Try to check even backwards.

      Comment


      • #63
        That weekly candle of the 11 week cycle is getting greener all the time. One clue to the S&P is one of it's componants. The chart is the S&P overlayed with GE and you'll see it bottoms about 20-30 days before the S&P. Of course the market could do the unexpected, but a HUGE push up to December 1-10 time frame is very possible.
        Attached Files

        Comment


        • #64
          Where are you Fab? Here's one for the bear in you, the 55 week cycle.
          Attached Files

          Comment


          • #65
            Here I am!

            Fabrizio L. Jorio Fili

            Comment


            • #66
              I took my conclusion about it : What yours ?
              (Bradley reversal....)

              Last edited by fabrizio; 11-01-2003, 04:35 AM.
              Fabrizio L. Jorio Fili

              Comment


              • #67
                I had a whole page of squares and square roots made, only to see at the last second I had one price wrong so it was all wrong. Too much Halloween last night. Are you long or short? I'm short as of Friday , until the market proves itself above 1054. I have a cycle date for Nov 8, which I will look again to see if it's OK to go long again. The chart is a 77 week cycle, and it's pattern is low-low-high. The 97 low, 98 low and 2000 high. Then the 2001 low and past March low, with a high coming. The half cycles are for cycle research, to show a left and right translated cycle. This move has the look of a right translated cycle and so a late ending would work, like 1552 days from March 2000, or sometime in June of 2004 before a crash like decline in late August 2004. But the high for the year is where I'm at now, with Dec 11 as the date , and either 1093 or 1115 as the price. The price can come sooner and Dec 11 will be the test of the high. This all depends on what happens between now and Nov 8. I've been waiting for Oct 30 and Dec 11 since the March 12 lows to start buying puts so now I just have to listen to what the market whispers to me.
                Attached Files

                Comment


                • #68
                  Square of 9
                  Attached Files

                  Comment


                  • #69
                    I'm Flat on futures closing the week with strong profits; waiting to buy it low since he well reacted down to the ellipse at 1051; any point consolidating above1052/1054 area is - IMHO-a good long scaling out over the week.

                    I'm long on some stocks geometrically good and with an acceptable risk/reward ratio ( already in profit)

                    I'm in with options on S&P with a Bear put strategy ATM (Dec 1040 & 1035) (little profit)

                    I'm Short on Beans ( Losses)

                    I will go short on gold Monday according to the Stocks behave.

                    PS. What is the DUE meter you have below the SQ9 of Global?
                    I do not have it on mine.
                    Last edited by fabrizio; 11-02-2003, 01:38 AM.
                    Fabrizio L. Jorio Fili

                    Comment


                    • #70
                      Playing with the connections of March 24 2000 to Sept 21 2001 and then to March 12 2003 and Dec 11 2003. DU Meter is @ the link http://www.dumeter.com/scrshots.php
                      Attached Files

                      Comment


                      • #71
                        More doodling. The last set of price/time is pointing to Dec 11 and 1093. About half of the decline of March 2000 to Sept 2001 but same percentage.
                        Attached Files
                        Last edited by theplumber; 11-02-2003, 02:18 PM.

                        Comment


                        • #72
                          Some number stuff and seperate Square of 9 stuff adding the days from March 12 lows and finding cycle low dates.
                          low-to-low or high-to-high dates and subtract the number of days or weeks
                          and then add the square roots of numbers to them.Add the result to the start
                          date .I guess you could say a generic growth cycle.
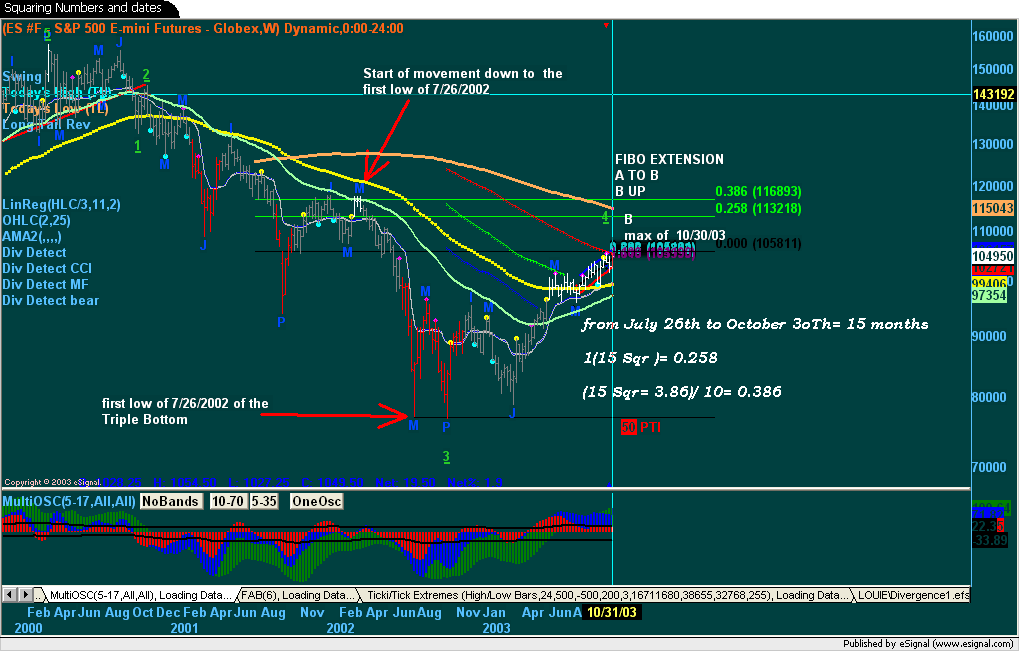
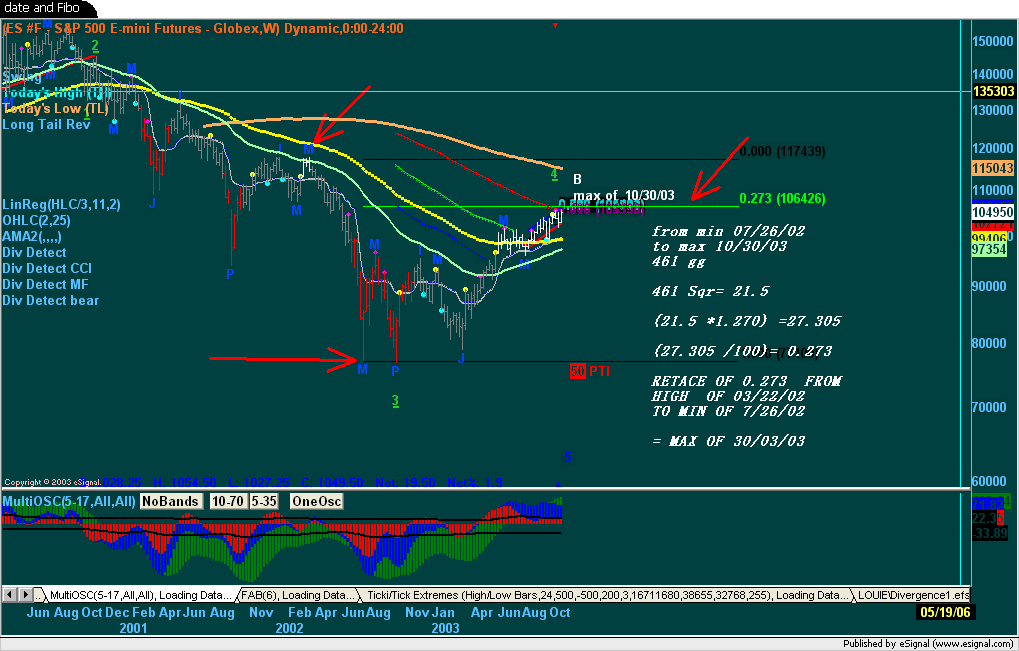
                          Goes something like this, 11 weeks times sqrt 2 is 15.5, add 15 weeks to July 24 and get Nov 6. Or round up 15.5 to 16 and get Nov 13.
                          Either way it's a cycle top or bottom.


                          July 24 2002 to Oct 10 2002
                          78 days or 11 weeks this table uses 11 weeks

                          2 3 4 5 6 7 8 9
                          ---------------------------------------------------
                          Nov6 Dec4 Dec25 Jan15 Jan29 Feb12 Feb26 Mar12
                          2002 2002 2002 2003 2003 2003 2003 2003

                          Aug 22 2002 to Dec 2 2002
                          102 days or 14.5 weeks

                          2 3 4 5 6 7 8 9
                          --------------------------------------------------
                          Jan19 Feb13 Mar13 Apr1 Apr23 May15 June6 June18
                          2002 2003 2003 2003 2003 2003 2003 2003

                          Oct 10 2002 to March 12 2002
                          153 days or 22 weeks

                          2 3 4 5 6 7 8 9
                          --------------------------------------------------
                          May15 July1 Aug14 Sept18 Oct24 Nov20 Dec18 Jan15
                          2003 2003 2003 2003 2003 2003 2003 2004

                          Since the March lows it's tough to do this because
                          the best results come from high or low that holds
                          for at least 1 month

                          July 1 2003 to August 6 2003
                          36 days or 5 weeks
                          This table uses days and weeks

                          2 3 4 5 6 7 8 9
                          --------------------------------------------------
                          Days Aug 21 Aug26 Sept11 Sept19 Sept27 Oct4 Oct11 Oct17

                          Weeks Aug19 Aug26 Sept9 Sept16 Sept23 Sept30 Oct7 Oct14


                          August 6 to Sept 30
                          55 days or 8 weeks

                          2 3 4 5 6 7 8 9
                          --------------------------------------------------
                          Days only Oct23 Nov9 Nov24 Dec7 Dec19 Dec30 Jan9 Jan18
                          Attached Files
                          Last edited by theplumber; 11-08-2003, 08:53 PM.

                          Comment


                          • #73
                            Plumber

                            Bradley inversion gives 11/22 as market top
                            Bradley gives 11/22 as market bottom

                            Some checks looking at venus uranus ASPECTARIANS & TRANSIT
                            in that date
                            Fabrizio L. Jorio Fili

                            Comment


                            • #74
                              but as I pointed out last week , I am convinced of a BRADLEY INVERTED . So IMHO taking in account the yestreday Lunar eclipse, I will be whatching carefully limiting my operativity until the end of the week . In this chart


                              I humbly foreseen a 1064. We hit a 1060. By next days I - always humbly - believe that the thrust isn't over . Not a 1200 but a good thrust. and then finally down.
                              this is my humble opinion.
                              Fabrizio L. Jorio Fili

                              Comment


                              • #75
                                I admit that the market going into year end will be very interesting, but what if at the March 12 lows of 789 I said the S&P would touch 1050. Would you think I was crazy then? You would say I needed my head examinied but look where it is now. The Bradley model has many flaws that software has improved upon. Even Bradley's original presentation was not exact but he waited for the right time so it would be best curve fitted. This first chart is what he presented.
                                Attached Files

                                Comment

                                Working...
                                X