 Tweet
Tweet
ES Levels question
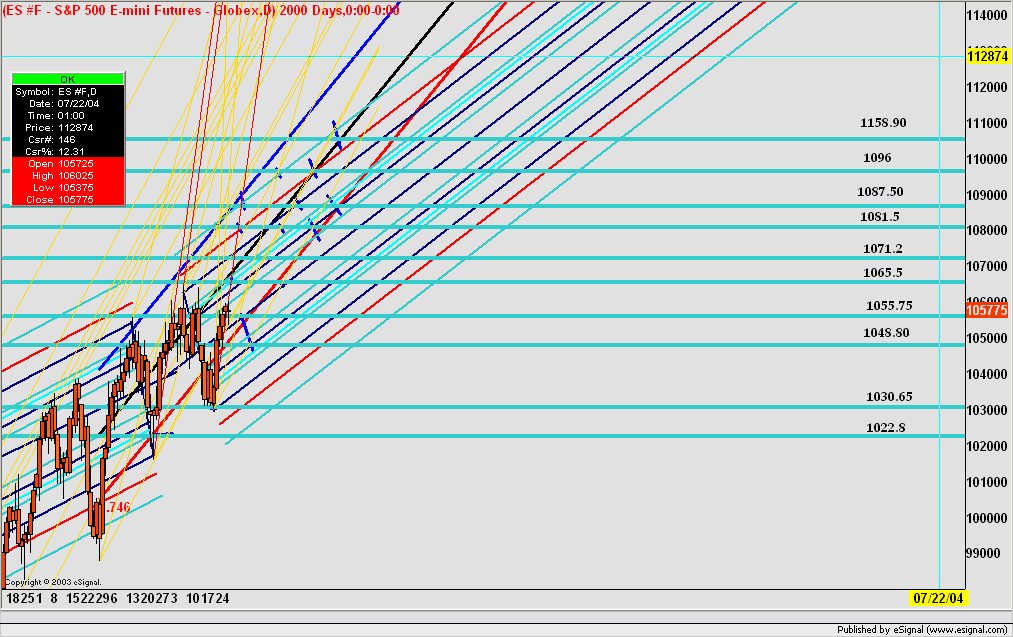
Hi: I have a question for the Plumber. I have some levels for the emini for 11/27 on I think they are based on fibonacci or geometric progressions. Please look at them and see if they match up to anything you are doing or you might have an idea about how they are being created.
The levels:
1090, 1080.90, 1071, 1064.30, 1059.20, 1049.50, 1046.20, 1040.30, 1035.30, 1027.30
Thanks,
Harndog
Comment