Announcement

Collapse
No announcement yet.

Fibo & Geometry

Collapse
X
 
  • Filter
  • Time
  • Show
Clear All
new posts

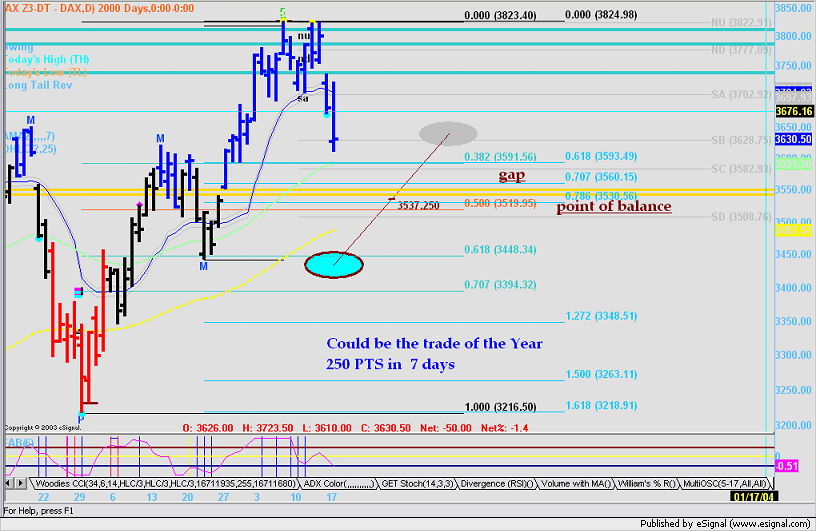
  • The DAX is very important to look at as well. The markets around the world are all connected in this day and time of 2003. In fact it's my contention that the Kwave rotates around the world and is the reason the US will not have the Prechter depression. Europe was hit in the 1860's, then the US in the 1930's and now Japan in the 1990"s, it rotates around the world.The DAX doesn't seem very liquid, do you swing trade it?


    Originally posted by fabrizio
    Apologize for posting on Dax, But is just a confirmation of what charted on the previous posts.

    http://share.esignal.com/ContentRoot...apshot-107.png

    Comment


    • Yes; generally I do the morning on it and switch to Es after 9:30 AM CST

      It seems not liquid but it is ( 40/50 K a day) Great contract, 90% correlation with ES till Noon CST.

      Higly volatile but wonderfull;
      Fabrizio L. Jorio Fili

      Comment


      • S&P hitting the 1X1 line from Mar 12 now and will look to go long with a tight stop . I'm looking to buy @1036 or so.Looking for 5 points so 1040-1041 target
        Last edited by theplumber; 11-17-2003, 08:53 AM.

        Comment


        • I didn't like how the action acted so exited @1039. On an analysis note the chart is the divisions of the circle multiplied by e, or 2.718, using the 7 minute time frame.


          Originally posted by theplumber
          S&P hitting the 1X1 line from Mar 12 now and will look to go long with a tight stop . I'm looking to buy @1036 or so.Looking for 5 points so 1040-1041 target
          Attached Files
          Last edited by theplumber; 11-17-2003, 09:31 AM.

          Comment


          • This is a 16 trading day cycle that goes back to 9/01/98 and has work well since. Sometimes it's early and sometimes it's late, and sometimes it's overtaken by bigger cycles but it always has shown up at good times to go long for a short term trade.
            Attached Files

            Comment


            • The bear case is the pop Tuesday is only temporary as not enough time has passed for the decline to really end. The time lines are slopping up, if of course the rally since March isn't over already, so a dip back to 1028 Tuesday to 1030 by Friday (the red line at a minimum that slopes up) and the rally can resume.
              Attached Files

              Comment


              • Chris

                My opinion is that hit 36.50 and not holding the 38.00
                has probably anticipated the Bradley.

                34.00 is an important minimum, once broken is All the way down to 1015 and 1005 theby the end of the month (the 27th?)

                Fabrizio L. Jorio Fili

                Comment


                • Fabrizio L. Jorio Fili

                  Comment


                  • Fabrizio L. Jorio Fili

                    Comment


                    • I haven't used AGET for a long time but I must say it's pretty good from this chart you posted. If you see my chart the first price level for a test is 1030 (the red line) and the next one is a combo of the blue and green intersection @ 1008. But time is more important so the decline will end Friday afternoon. To edit this I've got exact dates of either Nov 24 or Nov 26 depending on how many up days the S&P has between now and Friday. I really like the 26th to make swing trade longs.


                      Originally posted by fabrizio
                      Chris

                      My opinion is that hit 36.50 and not holding the 38.00
                      has probably anticipated the Bradley.

                      34.00 is an important minimum, once broken is All the way down to 1015 and 1005 theby the end of the month (the 27th?)

                      Attached Files
                      Last edited by theplumber; 11-18-2003, 07:46 PM.

                      Comment


                      • Very good work here. Nov 23 is a Sunday so my target date is Monday the 24 or Wednesday the 26. Also see the price levels on the square of 9


                        Originally posted by fabrizio
                        Attached Files
                        Last edited by theplumber; 11-18-2003, 07:46 PM.

                        Comment


                        • One indicator I wish Esignal had is the McClellan Osc. A very big trading bottom is coming, just like the late Sept, early Aug and late June. One more thing to consider is the componants that make up the S&P. Ge today was positive and bounces before the S&P. Also MSFT has a big gap it could fill and drag the S&P to 1093 if it did.
                          Attached Files

                          Comment


                          • theplumber
                            You can find the McClellan Oscillator coded by JasonK in this message
                            Alex

                            Comment


                            • Originally posted by Alexis C. Montenegro
                              theplumber
                              You can find the McClelllan Oscillator coded by JasonK in this message
                              Alex
                              Thanks, I guess I'm not paying enough attention to other threads

                              Comment


                              • The plan could be this:
                                Short 10 on ND Z3
                                LONG 3 ES Z3 arbitraging
                                Short 4 on DAX

                                Long 25 on NOTE & MUNI or US

                                Windows of 7 exchange days

                                Last edited by fabrizio; 11-19-2003, 01:58 AM.
                                Fabrizio L. Jorio Fili

                                Comment

                                Working...
                                X