Announcement

Collapse
No announcement yet.

Fibo & Geometry

Collapse
X
 
  • Filter
  • Time
  • Show
Clear All
new posts

  • Questions at the close of 8 jan: is 1130.8 good enough to sell the Gann 1131 as given by Plumbers SQ9 earlier this week. Below a condensed version is given. According Gann the safest sell area is at the secondary rally after the top. But how to find out the end of that rally Combining Gann with other forecasting methodes might help.

    The heavy sell initially suggested 1130.8 was good enough. Straight down to support at 1122. But then quickly up to 1129. Looking at the 1-min charts and applying some basic Elliot Wave rules 1129 was the first indication of more upward market action to come. AdvGet is not needed, this can be done by hand.

    According to Neely a good impuls action will not retrace more then 62%. As a down movement was expected the bounch up to 1129 indicated that this was not yet the down move as expected. This got confirmed by the 50% retrace to 1126 in the 2e 1-min chart and the break of the trendline. The 3e chart is my EW count for an ending diagonal, assuming CIT at 1131. 1 and 4 are overlapping. 4 is 62% retrace. The 3-5 trend line can be drawn based on the 2-4 direction. wave 3 is never the shortest so at the completion of 4 the end target can be calculated and plotted based on the trend line. Wave 3 length is 4.19 so wave 5 could not go beyond 1131.77. The trend line shows slightly less.

    At 1131 Gann SQ7 did it's work. A quick move down to 1127 support. Then a 37% retrace confirming an impuls wave down.

    How far will it go? The hourly chart shows the move up since mid december which has many EW extentions, complicating proper counting. The red trend line assumes a wave 2 completed at 1068. As alternate, the yellow line completes wave 2 at 1072. Both are also a Gann numbers but 1068 appears better. 1072 could then be a lower level 2, part of the wave with all extentions, suggesting that 1131 was the 5 of that lower level and hence, 3 of the higher level. So the current move down should be wave 4 of an higher level started from 1053
    Attached Files

    Comment


    • Originally posted by tedk
      Questions at the close of 8 jan: is 1130.8 good enough to sell the Gann 1131 as given by Plumbers SQ9 earlier this week. Below a condensed version is given. According Gann the safest sell area is at the secondary rally after the top. But how to find out the end of that rally Combining Gann with other forecasting methodes might help.

      The heavy sell initially suggested 1130.8 was good enough. Straight down to support at 1122. But then quickly up to 1129. Looking at the 1-min charts and applying some basic Elliot Wave rules 1129 was the first indication of more upward market action to come. AdvGet is not needed, this can be done by hand.

      According to Neely a good impuls action will not retrace more then 62%. As a down movement was expected the bounch up to 1129 indicated that this was not yet the down move as expected. This got confirmed by the 50% retrace to 1126 in the 2e 1-min chart and the break of the trendline. The 3e chart is my EW count for an ending diagonal, assuming CIT at 1131. 1 and 4 are overlapping. 4 is 62% retrace. The 3-5 trend line can be drawn based on the 2-4 direction. wave 3 is never the shortest so at the completion of 4 the end target can be calculated and plotted based on the trend line. Wave 3 length is 4.19 so wave 5 could not go beyond 1131.77. The trend line shows slightly less.

      At 1131 Gann SQ7 did it's work. A quick move down to 1127 support. Then a 37% retrace confirming an impuls wave down.

      How far will it go? The hourly chart shows the move up since mid december which has many EW extentions, complicating proper counting. The red trend line assumes a wave 2 completed at 1068. As alternate, the yellow line completes wave 2 at 1072. Both are also a Gann numbers but 1068 appears better. 1072 could then be a lower level 2, part of the wave with all extentions, suggesting that 1131 was the 5 of that lower level and hence, 3 of the higher level. So the current move down should be wave 4 of an higher level started from 1053

      Why haven't you posted before?

      One statement that comes to mind about Gann is the end of any move is always the most profitable.

      Comment


      • Any progress? To days action looks like a replay of Europe earlier today. So mainly sideways and no real indication of direction.
        The hour chart has not changed much. A megaphone is visible. The lower trendline held and on the daily 1120 confirmed support for a further uptrend. 5/35 OSC (look at AdvGet section) retraced to zero so it could indeed be the bottom of a wave 4.

        However, if 1120 was bottom of 1 then the retrace should be limited to 1127 (62%) max, pref 1126 (50%). Sort of kiss the trendline. But not much time left. Before the close the market must turn down but given the possible replay the sell setup might fail.
        For me, it needs a break below 1122 (180 degree) to have a sell. A break below 1120 would confirm.
        Attached Files
        Last edited by tedk; 01-12-2004, 01:00 PM.

        Comment


        • Originally posted by theplumber
          Why haven't you posted before?

          One statement that comes to mind about Gann is the end of any move is always the most profitable.
          The rate and the quality of your postings is so high, it is hard to get inbetween
          Last edited by tedk; 01-12-2004, 12:55 PM.

          Comment


          • Waiting for this trend strength from Nov 21 to fall out of bed, BUT IT NEVER DOES. Every channel is held, every sqrt extension is tested and then breaks. Play the channels.
            Attached Files

            Comment


            • A great forecasting tool is the Wave59 natal forecast. Has to be tweeked but is a great model. Power of basic astro at it's best.
              Attached Files

              Comment


              • A great addition to Esignal would be any kind of statistical tools that work with price and time. This is Ensigns and it shows 1/9 was a typical Friday, start at the highs and bleed down all day or at the very least finish flat. 1/12 was a typical Monday with the low in the first hour and finishing at the top 90% price range of the day. If you use Excel (or Openoffice like me) you can shrink this down to 5 minute time frames for any given day and see when the typical turn comes on a Friday or Monday . Patterns repeat for periods of time, this one has for 3 months now.
                Attached Files

                Comment


                • Natal Forecast (wave59)

                  Does anyone know, if this can be coded in esignal using .efs file?
                  Wave59 has some great astro indicators. If not all, but, some good reliable astro indicators can be duplicataed in esignal using .efs files, that would be great.

                  Comment


                  • wave59

                    I have to admit this is the coolest looking tool they have. I just wish I could find a use for it, been playing with it on all time frames for about 3 days now (only sleep 3 hours a night so don't say I don't have a life ) but can't find the consistency that can be tradable.
                    Attached Files

                    Comment


                    • plumber,

                      That's awesome! I had a blacklight poster like that in 1973. I think there were times when I would stare at it and know what it was telling me. No chance of that now though.

                      Couldn't resist!
                      Cheers!

                      Matt

                      Comment


                      • Just an observation. Seems too perfect to have a square in price and time on a 10 minute scale but it seems everything is lined up to rally into expiry.
                        Attached Files

                        Comment


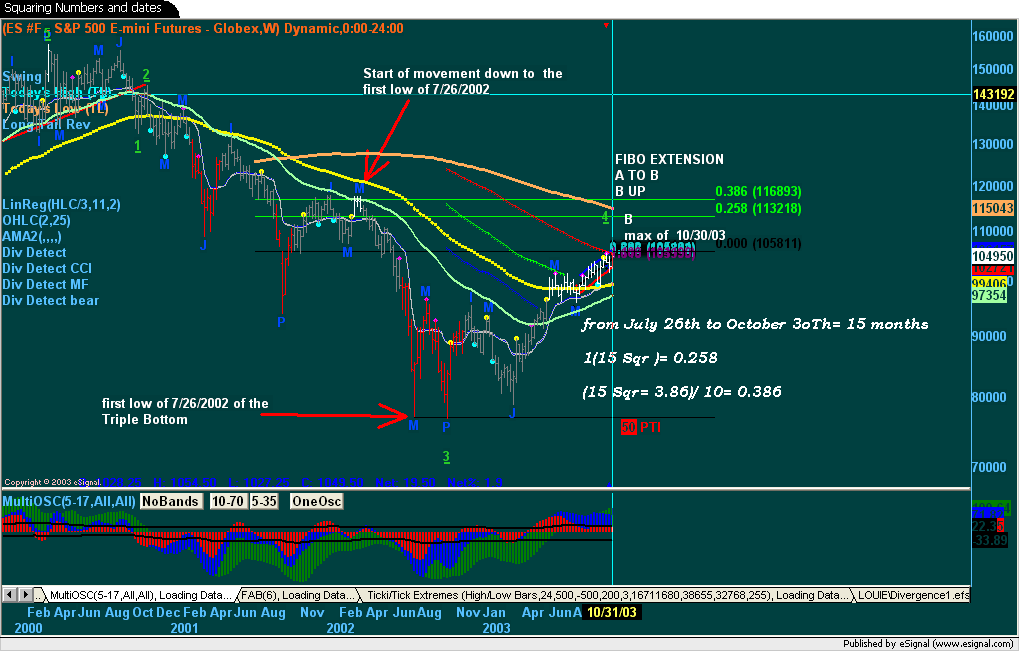
                        • You remember this post of mine of October 31St 2003 ?

                          Two targets:

                          The first was 1132.

                          The 9th of January we hit 1131

                          Fabrizio L. Jorio Fili

                          Comment


                          • You the man Fab

                            There's a big Gann turn date Jan 15 . If it's a high then it sells off, if it's a low then the sky's the limit.
                            Attached Files

                            Comment


                            • Last chance for proper impulse wave down assuming an iregular correction. Atleast the sell stoploss level is close and clearly defined.
                              However, given the bulisness in Europe earlier to day, the index is more likely to squeeze into expiration

                              17:25 Sell already gone
                              Attached Files
                              Last edited by tedk; 01-14-2004, 09:22 AM.

                              Comment


                              • Where's your geometry charts my fellow Texan?


                                Originally posted by mattsb
                                plumber,

                                That's awesome! I had a blacklight poster like that in 1973. I think there were times when I would stare at it and know what it was telling me. No chance of that now though.

                                Couldn't resist!

                                Comment

                                Working...
                                X