That's what it's all about, the combination of price and time, not price alone. Some very smart people went short the NDX and S&P in mid 1999 only to be squeezed in late 1999 and early 2000. This is why as a trader timing is everything. Price may go further or shorter than you think, but time will always mark the turn.This is the reason I gave a morning high probability, as well as the same time being hit by other geometric measures. Another timing man is Tom DeMark, count the numbers of bars from the low on my chart to high, 13.
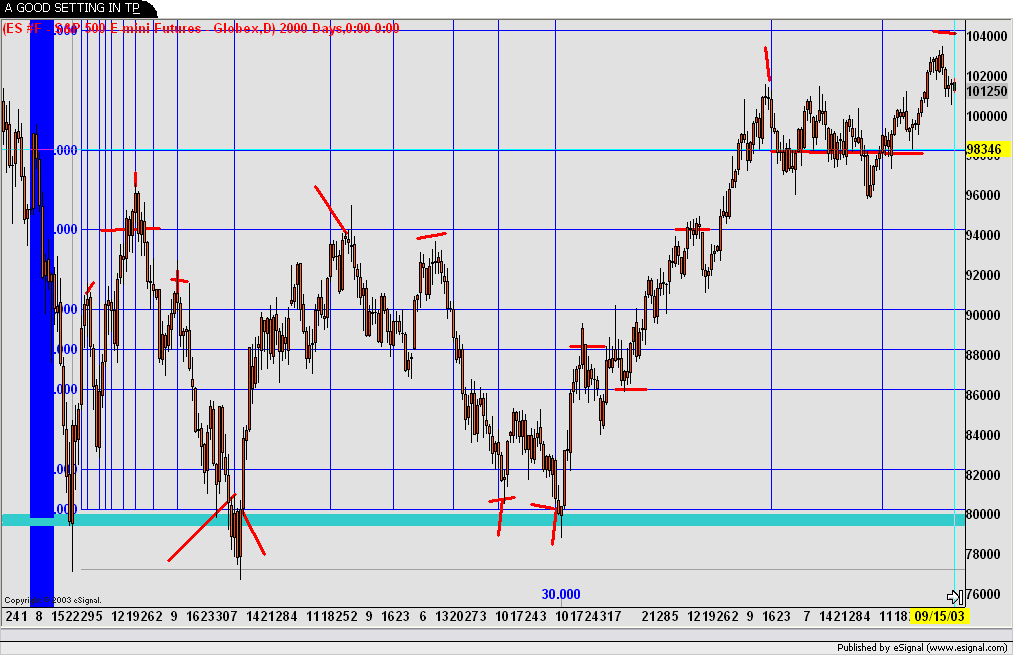
Originally posted by fabrizio 8 swings perfectly catch in time out of 16.
8 or 9 price level catched .....not bad
I'm very time constrained this time of year and won't be posting as much. Some past history says Dec declines after the first few days into the Dec 15-19 time frame and then have a rally. The seasonals say the same thing for now as well as my work.
If you look at the cluster that hit 03/12/03 all planetary lines hit
that day except the Jupiter line, which held up the Feb low. The next cluster is late December/early January, which I think will be the high for all of 2004
This is the astro configuration for late Dec 2003 and extends into early January.The same configuration of a square of 2 planets that are opposite. The same configuration for Sept 1 2000, March 12 2003, and upcoming Dec 30-Jan 3 2004
I posted this a few weeks ago about the simularity of 1932 bottom and retest and 2002 bottom and retest. History repeats itself, as a high was made Feb 5 and was the high for that year. I expect a high in early January and that to be the high for all 2004.
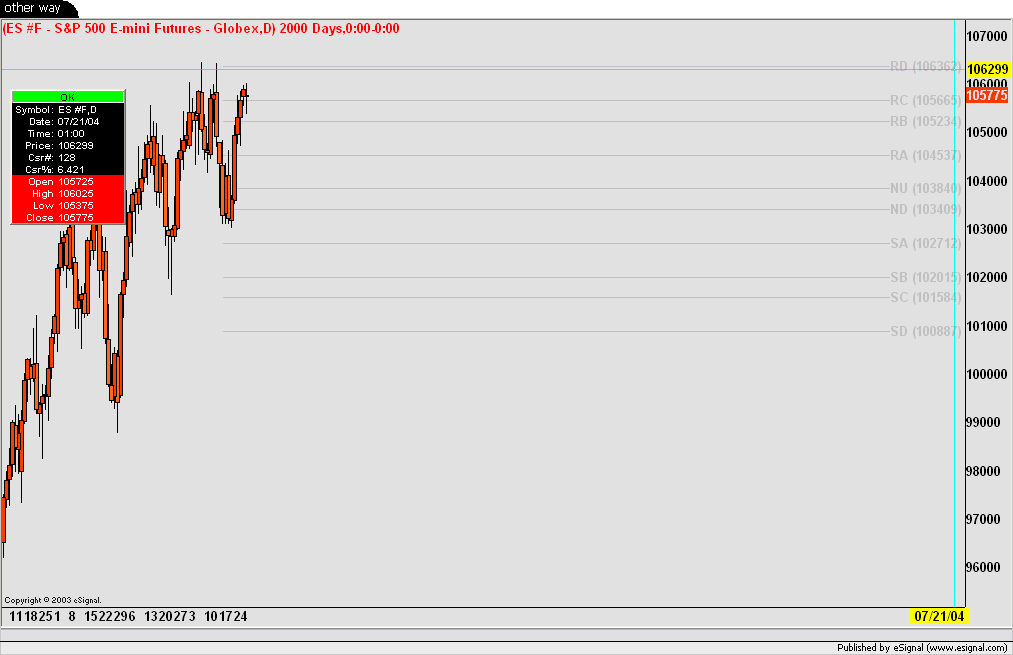
One more thing. The universal clock by Jeanne Long is a must have to convert planets to price. Look at the planet symbols on the prices and match it to the outer wheel. For example Mars is 1073 , Venus is 1070, the yellow one is the sun @ 1067 and the black one is the moon @ 1065, or todays low price.
 Tweet
Tweet


Comment