This is the latest model with price data. The Bradley model may not be inverted, this is why I told you to watch for a mini-crash and to buy it. The mini-crash could have started Friday I don't know. I do know that my model shows this possibility, and a huge run into early December. I admit that after much work this weekend that I wondered if Dec 1-10 time frame would invert and be a cycle low. I even wonder if November 26 will be the high date instead of Dec 11. But the final price of 1152 for next year is not doubted by me, this is where time and price will meet, just like Sept 1 2000/ Oct 10 2002 price/time relationship.
Announcement
Collapse
No announcement yet.
Fibo & Geometry
Collapse
X
-
AMOF I saidI will be whatching carefully limiting my operativity until the end of the week
as a matter of fact I did confirmed you I have still some confusion on the short term
During the day I post you some clues that reinforce the confusion.
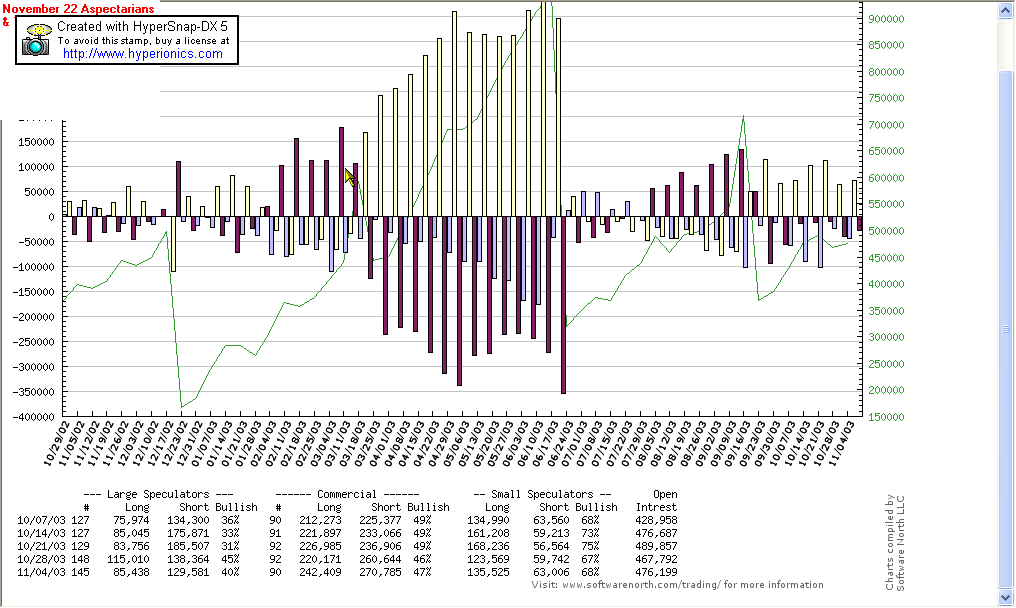
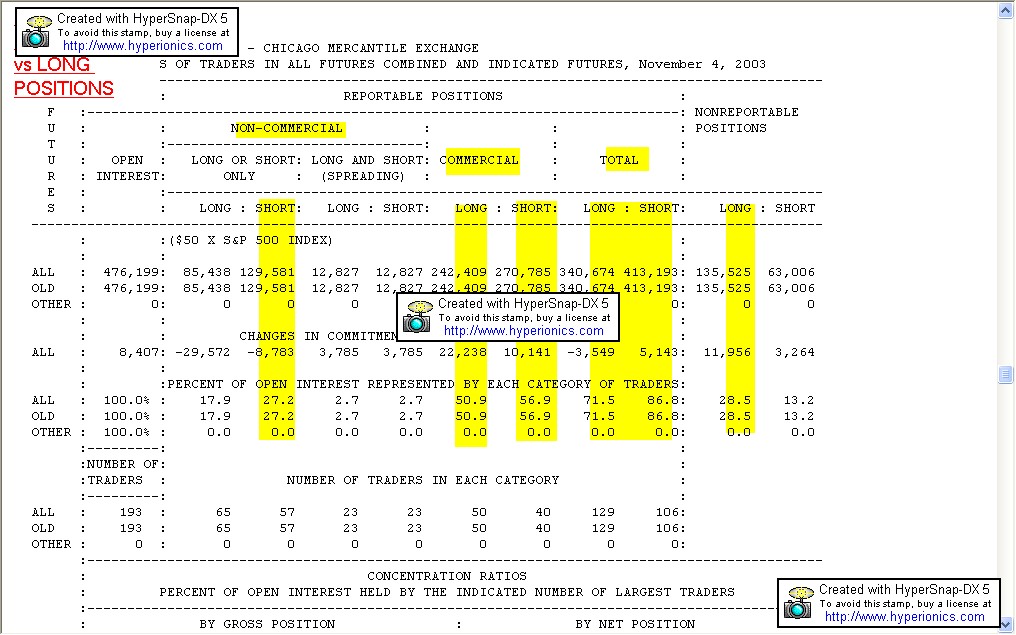
This market must be approached with different perspectives, since the technical answers are multiple. And honestly speaking I'm keep on saying we are on the border since June, and nothing really happens , in a convinced way I mean. If you look at the COT the situation is again of uncertainty .
We need to understand when will the commercial will make up their mind to either Buy or sell definitively this market.
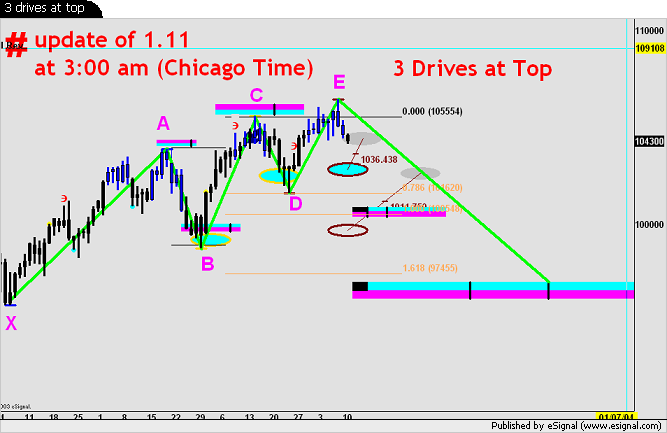
The Daily 3 Drives at Top is perfect with 1.272 ratios to -IMHO- justify the friday Up and down.; yet-IMHO- too irregular in design , time and proportion to build a castle upon.
On the weekly something maybe can come out.
The fact is that the correlation with the DJ is now following the Bradley reversal model.
I do not know: And in situations like this I hold myself flat . And watch carefully . ( of course I did not mentioned AGET analysis for is already clear to all as herebelow shown)
Lets see if Al can give some more hints.....
 Last edited by fabrizio; 11-09-2003, 05:12 AM.Fabrizio L. Jorio Fili
Comment
-
One thing I learned very early (by losing large amounts of money) was the market hurts the most people. This is why a mini-crash looks about right, kind of like the one about late Sept and had all the bears saying "told you so" only to be squeezed to a new high. The second worst bear market than this was the late 60s-early 70s and all bottoms were pushed to new (or almost new) highs.
Comment
-
I wondered when you would post a chart of the COT from a shorter time period. Look at this chart and yours. This is the 10 year note. Do you know why the commercials move side by side with the 10 year note? It has nothing to do with the S&P, it's a hedge for larger products, like bonds or forex. This is why I don't watch the COT that much.
Comment
-
I want to take back the crash alert after finding the jokers at EWI (Hochberg) is calling for a crash like 1987, NOT going to happen. Glad I found this out. Fab, if you want info better than COT (based on my explaination it is tied to rates not the S&P) you may want to try the link. It's about $50 a month but has great info/data to help you make up your own mind. The one bit of info that stands out to me is the specialist short ratio and the public short interest. The specialist ratio is at the lowest in years and the public is the highest. Happy trading my friend. http://www.astrikos.com/public/sample.html
Comment
-
-
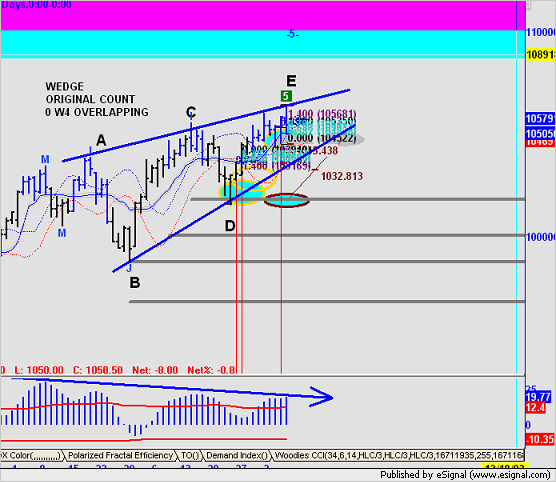
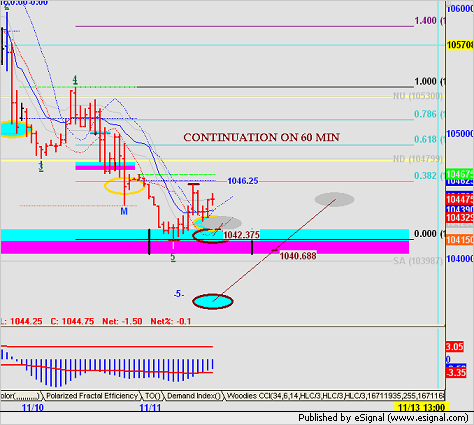
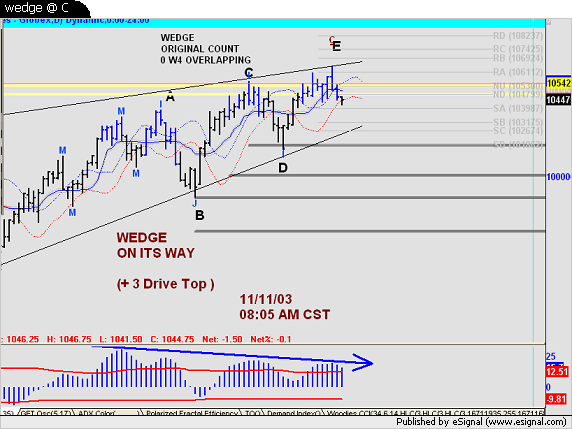
Imho hevay short for the following charted reasons and for:
- BRADLEY REVERSAL
- ASPECTARIAN REASONS IN VENUS URANUS AND IN 22ND NOV. CALCULATION,
-THE nov. 8TH LUNAR ECLISPSE .
- GEOMETRICAL AND FIBO PATTERNS ( Gemotrichal complex patterns from the 1016.26 ON S&P AND 3DRIVES TOP AT MER and S&P)
Always IMHO
 Last edited by fabrizio; 11-11-2003, 12:02 PM.Fabrizio L. Jorio Fili
Comment

Comment